Deskripsi
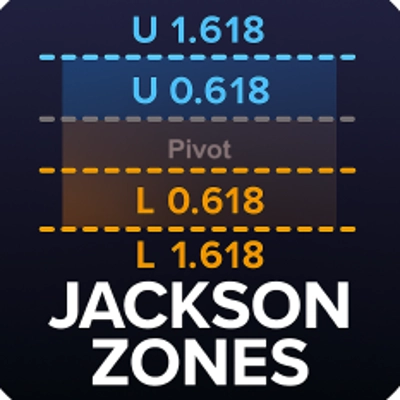
📊 Jackson Zones — Pemetaan Zona Fibonacci Adaptif
Ungkap ritme di balik aksi harga. Jackson Zones memetakan struktur intraday dan multiday menggunakan rentang sesi yang diproyeksikan Fibonacci, pelabelan adaptif, dan logika waktu yang kuat. Dirancang untuk kejelasan tingkat institusional, ini adalah keunggulan Anda di pasar yang volatil.
🔍 Fitur Utama
- Pengganda Fibonacci yang Dapat Disesuaikan
Tentukan rasio ekspansi Anda sendiri (default: 0.618, 1.000, 1.618) untuk menyesuaikan zona dengan strategi Anda.
- Mode Multiday: Alihkan untuk memperluas zona di beberapa sesi, mengungkap struktur yang persisten dan konfluensi jangka panjang.
- Logika Akhir Pekan
Secara otomatis menggunakan data Jumat untuk sesi Minggu dan Senin, memastikan level yang dapat diandalkan bahkan pada broker dengan bar Minggu.
- Fleksibilitas Visual
- Warna zona atas/bawah yang dapat disesuaikan
- Kontrol opasitas (0–255) untuk overlay transparan
- Label opsional yang secara dinamis mencerminkan pengganda pilihan Anda
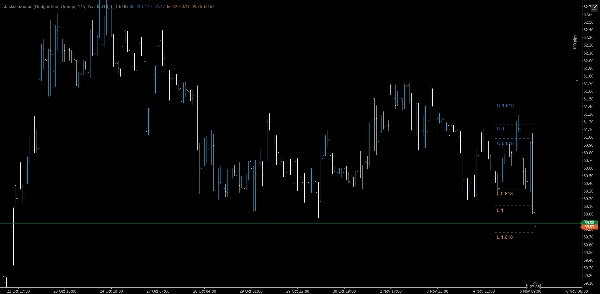
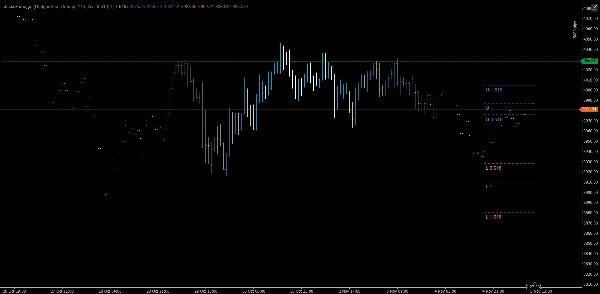
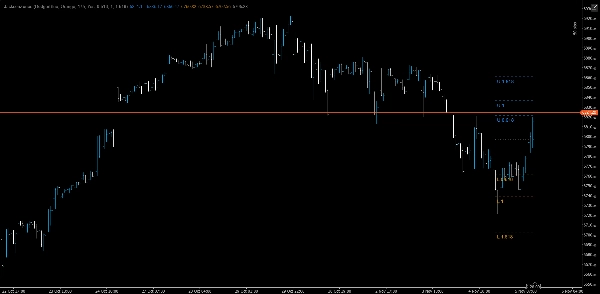
- Desain Overlay
Zona dan pivot dipetakan langsung pada grafik harga untuk konteks langsung.
🧠 Kasus Penggunaan
• Konfirmasi Breakout: Gerakan kuat melalui zona 1.000 atau 1.618 sering menandakan kelanjutan.
• Deteksi Reversal: Kegagalan di zona 0.618 atau 1.000 menyoroti kelelahan.
• Manajemen Perdagangan: Gunakan zona untuk penempatan stop, scaling, atau target keuntungan.
• Penambatan Sesi: Zona direset setiap hari, menyesuaikan dengan volatilitas yang berkembang sambil menghormati celah akhir pekan.
Ringkasan
Ulasan pelanggan
5 | 0 % | |
4 | 100 % | |
3 | 0 % | |
2 | 0 % | |
1 | 0 % |


