คำอธิบาย
ระบบ ATR Advanced Volatility & Trend
Average True Range (ATR) มาตรฐานเป็นเครื่องมือที่ยอดเยี่ยมสำหรับการวัดความผันผวนของตลาด แต่ในรูปแบบเริ่มต้น มันเป็นเพียงเส้นเดียวที่อ่านยาก มันบอกคุณว่าความผันผวนสูงหรือต่ำ แต่ไม่บอกวิธีการเทรด
ATR Advanced เปลี่ยนเมตริกพื้นฐานนี้ให้เป็นระบบการเทรดด้วยภาพที่สมบูรณ์ โดยการแนะนำเส้นสัญญาณความผันผวน (Volatility Signal Line), แท่งสีทิศทาง (Directional Paintbars) และฮิสโตแกรมโมเมนตัม (Momentum Histogram) มันบอกคุณไม่เพียงแต่เมื่อใดที่ตลาดเคลื่อนไหว แต่ยังบอกได้ว่ามีพลังขับเคลื่อนเทรนด์ปัจจุบันมากแค่ไหน
คุณสมบัติหลักของเวอร์ชันเต็ม:
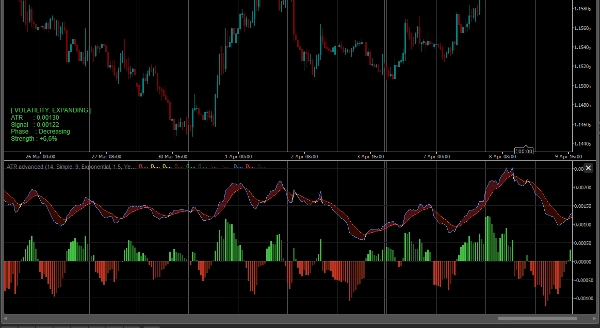
- เมฆขยายความผันผวน: เราเพิ่มค่าเฉลี่ยเคลื่อนที่ (เส้นสัญญาณ) ลงใน ATR พื้นที่ระหว่าง ATR กับเส้นสัญญาณจะถูกเติมด้วยเมฆไดนามิก
-
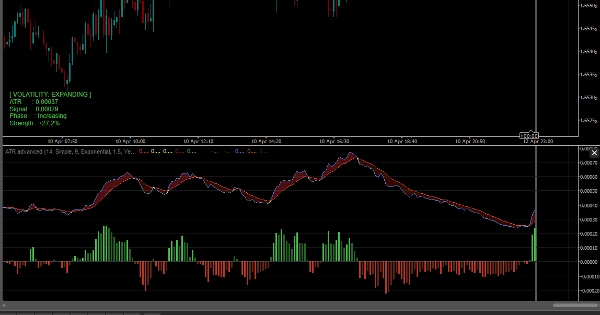
- เมฆสีเขียว (ขยาย): ความผันผวนกำลังเพิ่มขึ้น ตลาดกำลังตื่นตัวและเทรนด์แข็งแกร่ง
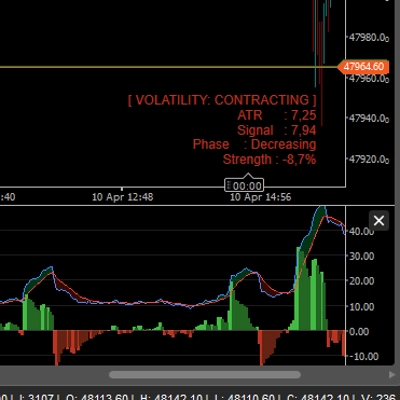
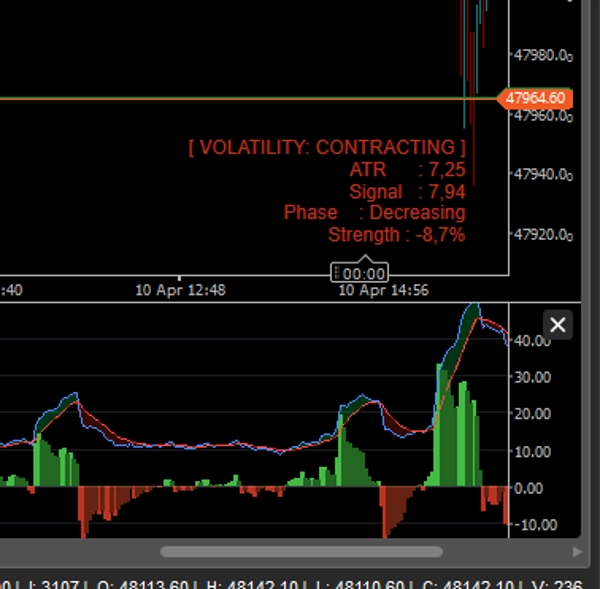
- เมฆสีแดง (หดตัว): ความผันผวนกำลังลดลง ตลาดกำลังรวมตัวหรือเคลื่อนไหวในช่วงแคบ
- ฮิสโตแกรมโมเมนตัม: ฮิสโตแกรมที่กำหนดเองด้านล่างติดตามความแตกต่างที่แน่นอนระหว่าง ATR กับเส้นสัญญาณ ช่วยให้คุณมองเห็นการเบรกเอาต์ของความผันผวก่อนที่จะเกิดขึ้นเต็มที่
- การลงสีแท่งเทียนอัจฉริยะ (ทิศทาง + ความผันผวน): นี่คือคุณสมบัติที่ยอดเยี่ยมที่สุด ตัวบ่งชี้อ่านทั้งทิศทางราคา (ขาขึ้น/ขาลง) และสถานะความผันผวน เพื่อระบายสีแท่งเทียนของคุณตามนี้:
-
- สีเขียว/แดงสดใส: เทรนด์แข็งแกร่ง + ความผันผวนขยาย (เหมาะสำหรับการเทรดเบรกเอาต์และเทรนด์)
- สีเขียว/แดงเข้ม: เทรนด์อ่อนแอ + ความผันผวนหดตัว (คำเตือน: โมเมนตัมกำลังลดลง)
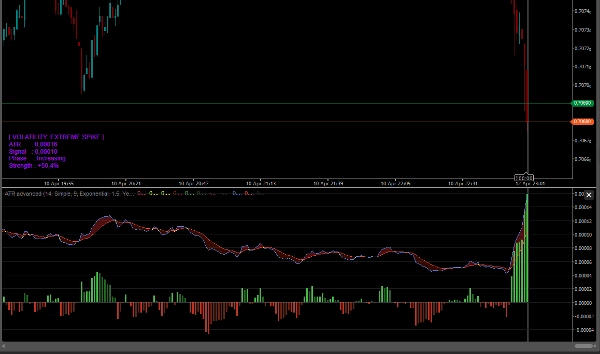
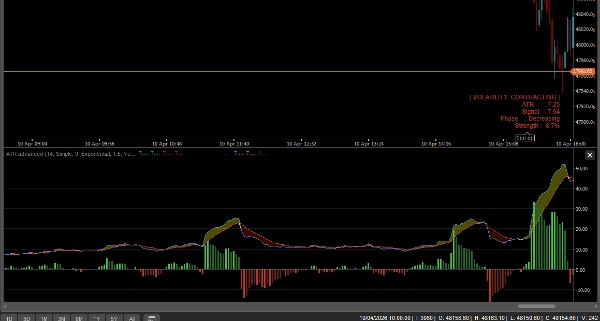
- การตรวจจับความผันผวนสุดขีด: เมื่อ ATR พุ่งสูงผิดปกติ (เช่น ในช่วงเหตุการณ์ข่าวใหญ่หรือจุดสูงสุดแบบ blow-off) แท่งเทียนจะเปลี่ยนเป็นสีม่วง (สุดขีด) เตือนคุณถึงจุดสุดยอดหรือการเบรกเอาต์ครั้งใหญ่ที่อาจเกิดขึ้น
- แดชบอร์ดข้อมูลแบบเรียลไทม์: แผงแสดงผลบนชาร์ตที่ดูดีแสดงค่าที่แน่นอนของ ATR, เฟสความผันผวน (ขยาย/หดตัว) และการอ่านความแข็งแกร่งเป็นเปอร์เซ็นต์
- ปลดล็อกอย่างสมบูรณ์: เทรดได้กับสัญลักษณ์ใดก็ได้ (Forex, Crypto, ดัชนี, หุ้น) และกรอบเวลาทุกประเภทโดยไม่มีข้อจำกัด ใบอนุญาตตลอดชีพ
วิธีการเทรดกับมัน?
- การเบรกเอาต์: หลีกเลี่ยงการเทรดเมื่อเมฆความผันผวนเป็นสีแดง (หดตัว) รอให้ ATR ข้ามเหนือเส้นสัญญาณ (เมฆเปลี่ยนเป็นสีเขียว) และแท่งเทียนของคุณระบายเป็นสีเขียวสดหรือแดงสด ซึ่งยืนยันการเบรกเอาต์ที่แท้จริงและมีโอกาสสูง
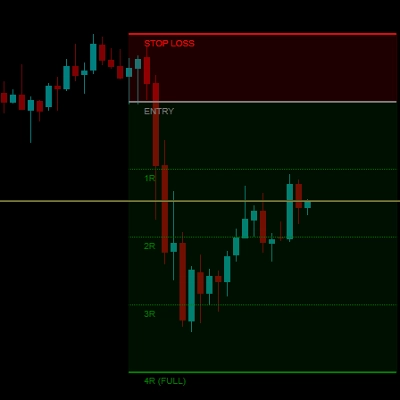
- การตั้งจุดหยุดแบบตามหลัง: อยู่ในเทรดที่ชนะตราบใดที่เมฆความผันผวนยังเป็นสีเขียว เมื่อมันข้ามลงและเปลี่ยนเป็นสีแดง หมายความว่าโมเมนตัมหมดแล้ว — เป็นเวลาที่ดีในการทำกำไร
- คำเตือนจุดสุดยอด: หากคุณอยู่ในเทรนด์และแท่งเทียนเปลี่ยนเป็นสีม่วงทันที โปรดระวัง! นี่แสดงถึงการพุ่งขึ้นของความผันผวนสุดขีด ซึ่งมักเกิดขึ้นในตอนท้ายของเทรนด์ก่อนการกลับตัวอย่างรุนแรง
สรุป
โปรไฟล์อินดิเคเตอร์
หมวดหมู่อินดิเคเตอร์
Momentum
ประเภทเอาต์พุต
การแสดงเป็นภาพ
สัญญาณ
ตัวกรอง
ข้อกำหนดด้านข้อมูล
แท่งเท่านั้น
สัญญาณที่รองรับ
ความแข็งแกร่งของแนวโน้ม
ความผันผวน
รีวิวจากลูกค้า
4.5
รีวิว: 2
5 | 50 % | |
4 | 50 % | |
3 | 0 % | |
2 | 0 % | |
1 | 0 % |
รีวิวจากลูกค้า
April 18, 2026
3 percent DD is the line to watch, and the log becomes easier to read.
การสนทนา
คำถามที่พบบ่อย
ATR
Moving Average
ผลิตภัณฑ์ที่มีให้บริการผ่าน cTrader Store รวมถึงบอทการเทรด อินดิเคเตอร์ และปลั๊กอิน มีให้บริการโดยนักพัฒนาบุคคลที่สามและมีไว้เพื่อวัตถุประสงค์ในการเข้าถึงข้อมูลและทางเทคนิคเท่านั้น cTrader Store ไม่ใช่โบรกเกอร์และไม่ได้ให้คำแนะนำการลงทุน คำแนะนำส่วนบุคคล หรือการรับประกันผลการดำเนินงานในอนาคต


ราคา
24
การขาย
710
ติดตั้งฟรี