present
ลงทะเบียนและรับส่วนลด $50 สำหรับการซื้อครั้งแรกของคุณ
Trading product for CQL Trend Strength Index อินดิเคเตอร์ Premium/Discount  Supertrend, image 1
CQL Trend Strength Index
อินดิเคเตอร์
57 ดาวน์โหลด
เวอร์ชัน 1.1, Aug 2026
Windows, Mac
Trading product for CQL Trend Strength Index อินดิเคเตอร์ Premium/Discount  Supertrend, image 2
Trading product for CQL Trend Strength Index อินดิเคเตอร์ Premium/Discount  Supertrend, image 3
Trading product for CQL Trend Strength Index อินดิเคเตอร์ Premium/Discount  Supertrend, image 4
Trading product for CQL Trend Strength Index อินดิเคเตอร์ Premium/Discount  Supertrend, image 5
36.24K
ปริมาณการเทรด
336
Pips ที่ได้กำไร
2
การขาย
57
ติดตั้งฟรี

คำอธิบาย

สิ่งที่มันวิเคราะห์

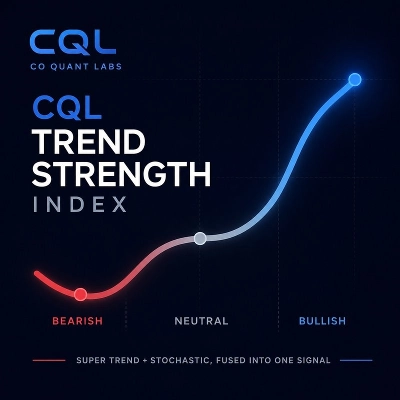
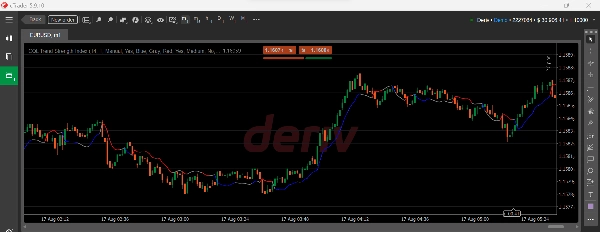
CQL Trend Strength Index รวม Supertrend และ Stochastic เข้าด้วยกันเป็นสัญญาณเดียวแทนที่จะรันแยกเป็นสองเครื่องมือบนชาร์ตของคุณ มันอ่านทิศทางราคาและโมเมนตัมพร้อมกันและจัดประเภทสภาพตลาดปัจจุบันเป็นหนึ่งในสามสถานะ: ซื้อแรง, ขายแรง หรือ ช่วงขาลง

วิธีตีความสัญญาณ

ตัวบ่งชี้จะแสดงเส้นเรียบเส้นเดียวตรงบนราคา สีของมันบอกทุกอย่างให้คุณรู้ได้ทันที:

  • สีน้ำเงินหมายถึง ซื้อแรง ราคาและโมเมนตัมยืนยันความแข็งแกร่งของขาขึ้น
  • สีแดงหมายถึง ขายแรง ราคาและโมเมนตัมยืนยันความแข็งแกร่งของขาลง
  • สีเทาหมายถึง ช่วงขาลง โมเมนตัมอยู่ในโซนเป็นกลาง บ่งชี้ความเชื่อมั่นต่ำไม่ว่าจะเป็นทิศทางราคาใด

นี่คือเครื่องมือบริบทแนวโน้ม ไม่ใช่ตัวสร้างสัญญาณเข้า มันบอกลักษณะของตลาดปัจจุบันเพื่อให้คุณสามารถใช้วิธีเข้าของคุณเองด้วยความเข้าใจที่ดีขึ้นว่าคุณกำลังเทรดตามแนวโน้มหรือในช่วงขาลงที่ผันผวน

การตั้งค่าและพารามิเตอร์สำคัญ

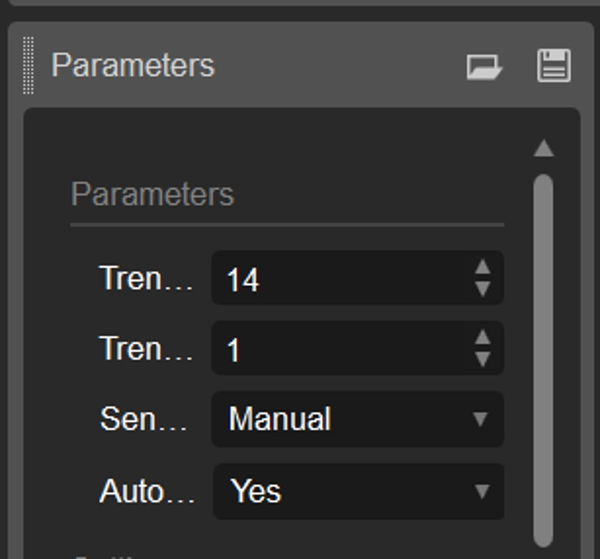
  • ช่วงแนวโน้มและความไวของแนวโน้มให้คุณควบคุมได้เต็มที่ว่าตัวบ่งชี้ตอบสนองเร็วหรือช้าเพียงใด
  • การตั้งค่าความไวล่วงหน้า (ช้า, กลาง, เร็ว, ด้วยตนเอง) ช่วยให้คุณปรับแต่งได้อย่างรวดเร็วโดยไม่ต้องแก้ตัวเลขดิบ
  • การปรับอัตโนมัติตามกรอบเวลา ปรับความไวโดยอัตโนมัติตามชาร์ตของคุณ
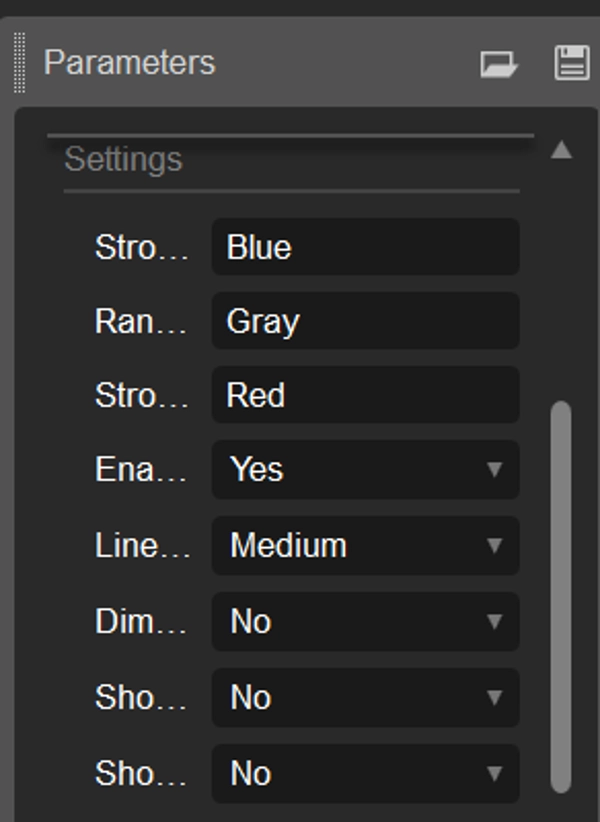
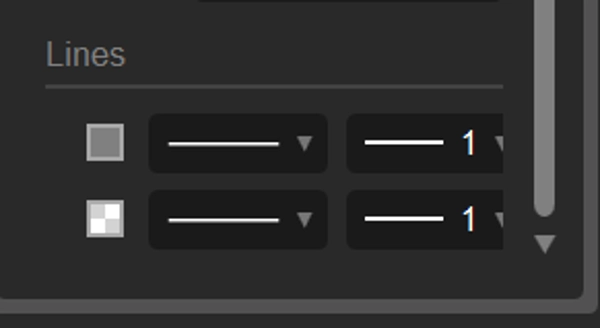
  • แท็บการตั้งค่าครอบคลุมการปรับแต่งสีเต็มรูปแบบ ความหนาของเส้น ป้ายสถานะ การย้อมสีพื้นหลัง และตัวเลือกรีเซ็ตเป็นค่าเริ่มต้น

กรณีการใช้งานทั่วไป

  • ยืนยันอย่างรวดเร็วว่าตลาดกำลังมีแนวโน้มแรงก่อนมองหาจุดเข้าโดยใช้เครื่องมือหรือวิธีอื่น
  • กรองสภาพช่วงขาลงหรือผันผวนที่กลยุทธ์ตามแนวโน้มมักทำผลงานได้ไม่ดี
  • รับการอ่านแนวโน้มอย่างรวดเร็วโดยไม่ต้องตีความตัวบ่งชี้สองตัวแยกกัน

เหมาะสำหรับใคร

เทรดเดอร์ที่มีวิธีเข้าซื้อขายอยู่แล้ว ไม่ว่าจะด้วยตนเองหรืออัตโนมัติ และต้องการตัวกรองบริบทแนวโน้มที่รวดเร็วและเชื่อถือได้เพิ่มขึ้น เหมาะสำหรับเทรดเดอร์สวิงแบบมีดุลยพินิจ รวมถึงผู้ที่สร้างระบบตามกฎที่ต้องการการจำแนกแนวโน้มชัดเจนระหว่างมีแนวโน้มหรือไม่มีแนวโน้ม

ข้อจำกัดและหมายเหตุการใช้งาน

  • นี่คือตัวบ่งชี้บริบทแนวโน้ม ไม่ใช่สัญญาณซื้อหรือขาย มันไม่ทำนายการกลับตัวหรือสร้างสัญญาณเข้า
  • เหมือนเครื่องมือแนวโน้มทั้งหมด มันจะล่าช้าในช่วงเริ่มต้นของแนวโน้มใหม่และอาจอยู่ในช่วงขาลงในช่วงเบรคเอาต์ที่มีโมเมนตัมต่ำ
  • ควรใช้ร่วมกับการจัดการความเสี่ยงและการยืนยันการเข้าเทรดของคุณเอง ไม่ใช่ระบบเทรดแบบสแตนด์อโลน

สรุป

สรุปโดย AI
The CQL Trend Strength Index is a technical indicator that combines Supertrend and Stochastic signals into a single, smoothed line plotted directly on the price chart. It classifies market conditions into three states: Strong Buy (blue), Strong Sell (red), or Ranging (gray), reflecting the combined analysis of price direction and momentum. This indicator serves as a trend context tool, helping traders quickly assess whether the market is trending strongly or moving sideways, rather than generating specific trade entry signals.

Key features include adjustable Trend Period and Reactivity settings, sensitivity presets (Slow, Medium, Fast, Manual), and automatic adaptation to the chart’s timeframe. Users can customize colors, line thickness, labels, and background zone tinting. Typical use cases involve confirming strong trends before applying entry methods, filtering out ranging conditions where trend-following strategies may underperform, and obtaining a clear visual read of trend health without managing multiple indicators.

Designed for traders with existing entry strategies, it supports discretionary and rule-based trading by providing a reliable trend versus no-trend classification. The indicator requires integration with personal risk management and entry confirmation techniques and is intended for use across various markets where price bars are available.

โปรไฟล์อินดิเคเตอร์
หมวดหมู่อินดิเคเตอร์
Trend
ประเภทเอาต์พุต
การแสดงเป็นภาพ
ข้อกำหนดด้านข้อมูล
แท่งเท่านั้น
สัญญาณที่รองรับ
ความแข็งแกร่งของแนวโน้ม

รีวิวจากลูกค้า

0.0
รีวิว: 0
รีวิวจากลูกค้า
ยังไม่มีรีวิวสำหรับผลิตภัณฑ์นี้ หากเคยลองแล้ว ขอเชิญมาเป็นคนแรกที่บอกคนอื่น!

การสนทนา

คำถามที่พบบ่อย

Premium/Discount
Supertrend
MSS
Stochastic
ผลิตภัณฑ์ที่มีให้บริการผ่าน cTrader Store รวมถึงบอทการเทรด อินดิเคเตอร์ และปลั๊กอิน มีให้บริการโดยนักพัฒนาบุคคลที่สามและมีไว้เพื่อวัตถุประสงค์ในการเข้าถึงข้อมูลและทางเทคนิคเท่านั้น cTrader Store ไม่ใช่โบรกเกอร์และไม่ได้ให้คำแนะนำการลงทุน คำแนะนำส่วนบุคคล หรือการรับประกันผลการดำเนินงานในอนาคต

เพิ่มเติมจากผู้เขียนคนนี้

"Vix75 Shield" โลโก้
สถิติสด
$85
/
$150
cBot
Forex
Crypto
+4
Stay on the right side of every major move on the Volatility 75 Index, automatically. No charts, no decisions.
7.6%
ROI
2.6
อัตราส่วน กำไรต่อขาดทุน

นอกจากนี้คุณยังอาจชอบ

"Smart Volume Delta" โลโก้
ยอดนิยม
3.5
(4)
$19
/
$30
อินดิเคเตอร์
AI
ATR
+20
Detects smart money activity using advanced tick volume and price divergence analysis.
อินดิเคเตอร์
ADX
ATR
+2
Detects market regime - Optimized for BTC/USD - with adaptive EMAs, Hurst, ADX & confidence score.
"Binary Options Signals Pro" โลโก้
ยอดนิยม
4.6
(3)
$49
อินดิเคเตอร์
ATR
RSI
+5
Binary Options Signals Pro – Precision Trading at Your Fingertips
อินดิเคเตอร์
ATR
BOS
+5
Know how strong each Supertrend flip is: scored BUY/SELL, structure stop + 3 targets, live win-rate dashboard, alerts.
"Auto Tools Suite" โลโก้
ยอดนิยม
4.3
(3)
$19
/
$29
อินดิเคเตอร์
ZigZag
Indices
+2
Auto Trendlines, Fibonacci, Pitchfork and Patterns from non‑repainting pivots. One‑click Presets, targeted Alerts, and a
อินดิเคเตอร์
Engulfing
Fibonacci
+4
Six higher-timeframe candle sets on one chart, with liquidity sweep detection and swept levels.
อินดิเคเตอร์
ATR
Key Levels
+1
See both sides of the trade before you take either one.
"MACD Crossover PRO" โลโก้
ยอดนิยม
4.7
(4)
$19
/
$20
อินดิเคเตอร์
MACD
Prop
+14
Customize the MACD! Choose colors, get real-time tick updates, and see crossover points for enhanced trading precision.
อินดิเคเตอร์
ADX
ATR
+5
Designed exclusively for trading the Gold market (XAUUSD), GoldMasterIndicator provides institutional-grade technical!
อินดิเคเตอร์
ADX
ATR
+5
Ten confluence layers scored on every closed bar, with an anti-chop gate, pivot levels and a live dashboard.
อินดิเคเตอร์
Prop
Forex
+11
Ultimate Session Tool: Boxes, OR, KZs, PD Levels, Overlaps, Custom Lines & Names, Info Panel! Highly customizable 📉📈
อินดิเคเตอร์
Key Levels
Market Structure
+1
Sessions, ICT killzones, multi-ORB and previous levels. One clean, no-repaint cTrader overlay.
"Candlestick Patterns - Special Candles" โลโก้
เรตติ้งสูง
4.5
(4)
$19
/
$35
อินดิเคเตอร์
Boost your trading with Candlestick Patterns for cTrader – auto-detect key signals for smarter, faster decisions!
อินดิเคเตอร์
AI
ATR
+26
The Triple Momentum indicator for cTrader is a versatile trend-following tool.
อินดิเคเตอร์
ATR
Prop
+13
Enhance trading with ATR Bands! Visualize market volatility using dynamic upper and lower ATR bands for precise decision
อินดิเคเตอร์
AI
ATR
+26
SR Commander — Multi Timeframe Edition. See where the big money draws the line. Trade on your timeframe. Think on theirs
อินดิเคเตอร์
Area of Interest with the power of AI to detect the market interest.
"Dynamic Trend Gradient" โลโก้
เรตติ้งสูง
4.2
(5)
$19
/
$22
อินดิเคเตอร์
RSI
Signal
+2
Identifies trends with moving averages & volatility. Base levels = bullish 🐂 or bearish 🐻 signals. Reversals detected!

ราคา

36.24K
ปริมาณการเทรด
336
Pips ที่ได้กำไร
2
การขาย
57
ติดตั้งฟรี