说明
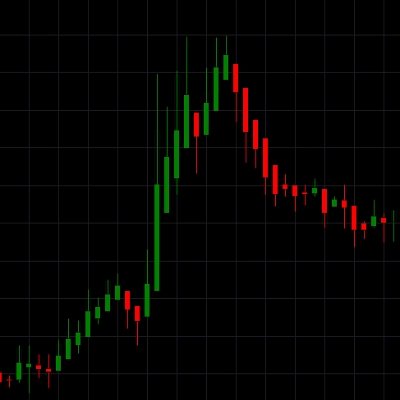
HeikinAshi 蜡烛图指标
安装:
将指标拖动到所需的图表上。
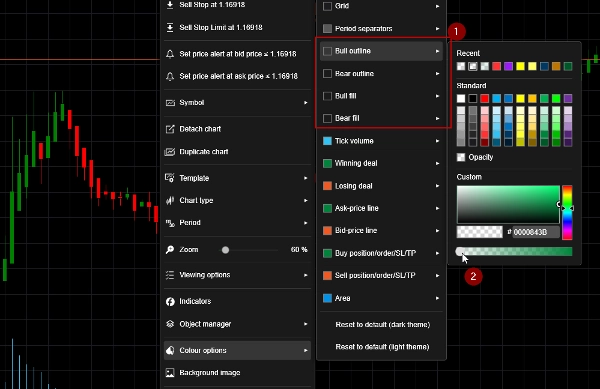
右键点击图表,选择“颜色选项”。
将多头轮廓、多头填充、空头轮廓和空头填充设置为“透明”。见截图。
摘要
指标配置
客户评价
0.0
评价:0
客户评价
该产品尚无评价。已经试过了?抢先告诉其他人!
讨论
常见问答
Forex
Signal
Crypto
Stocks
cTrader Store 提供的所有产品,包括交易机器人、指标和插件,均由第三方开发者提供,仅供信息参考和技术访问之用。cTrader Store 并非经纪商,不提供投资建议、个人推荐或任何未来业绩保证。


价格
注册日期 15/06/2025
672
免费安装