
VWAP Volume Weighted Average Price
Gösterge
Sürüm 1.0, Oct 2025
Windows, Mac
4.6
Değerlendirmeler: 3
Açıklama
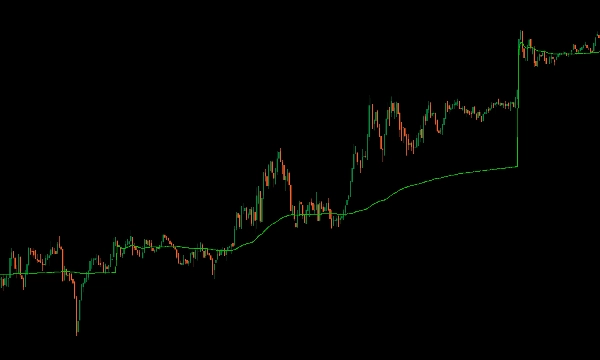
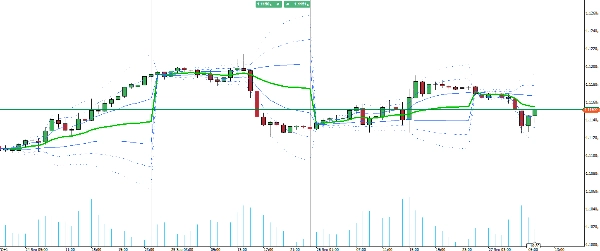
cTrader için VWAP göstergesini tanıtıyoruz, TradingView'in Hacim Ağırlıklı Ortalama Fiyat işlevselliğini ticaret platformunuza getiriyor.
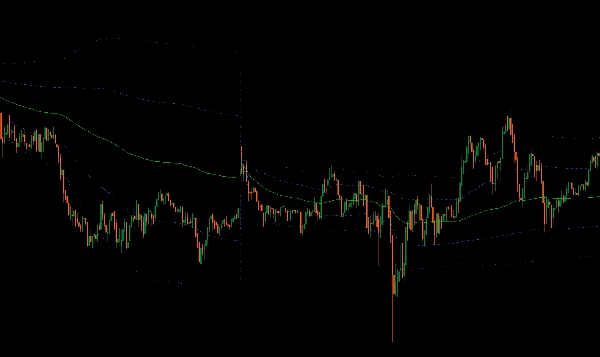
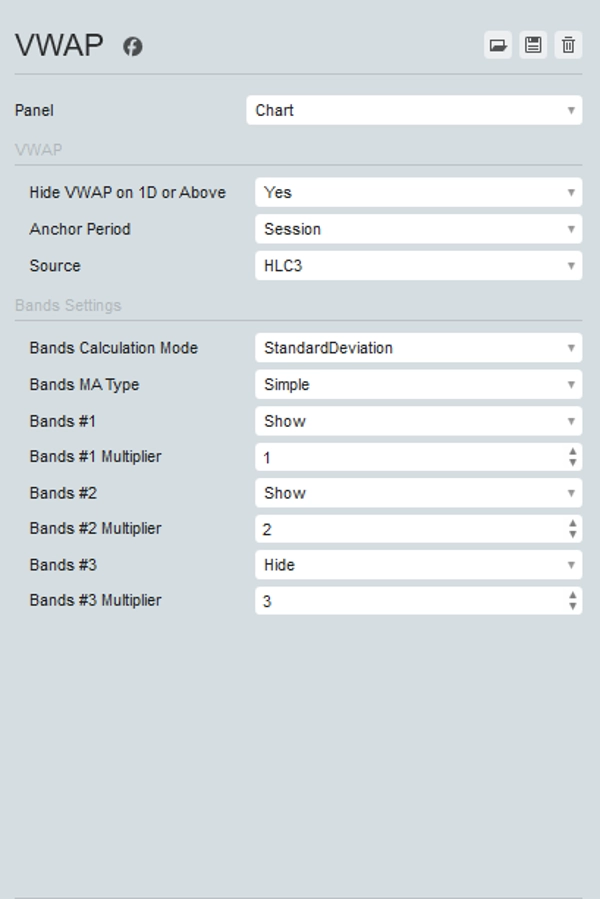
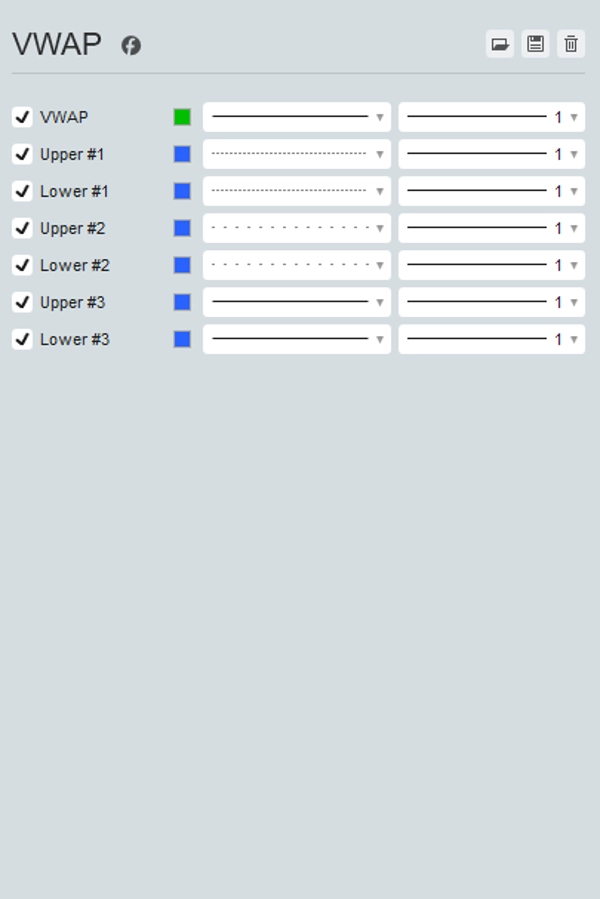
Bu kapsamlı araç, çapa döneminizi (Oturum, Hafta, Ay, Çeyrek, Yıl) seçmenize ve Açılış, Yüksek, Düşük, Kapanış, HL2, HLC3, OHLC4 ve HLCC4 dahil olmak üzere çeşitli fiyat kaynaklarından seçim yapmanıza olanak tanır. Ayrıca, fiyat dağılımının tam bir görünümünü sağlamak için üç standart sapma üst ve alt bantlarını görüntüleyebilir.
VWAP göstergesi, en doğru ve zamanında içgörülere sahip olmanızı sağlamak için gerçek zamanlı olarak tik verileriyle güncellenir. cTrader'da çok yönlü ve güçlü VWAP göstergesi ile ticaret stratejinizi yükseltin.
Özet
YZ özeti
The VWAP (Volume Weighted Average Price) indicator for cTrader replicates the full functionality of TradingView's VWAP tool. It allows traders to select anchor periods including Session, Week, Month, Quarter, and Year, and choose from multiple price sources such as Open, High, Low, Close, HL2, HLC3, OHLC4, and HLCC4. The indicator also supports displaying up to three standard deviation bands above and below the VWAP line, providing insights into price distribution and volatility. It updates in real time with tick data, ensuring timely and accurate information for trading decisions. This indicator is applicable across various markets including Forex, Crypto, Stocks, Commodities, and Indices, and supports symbols like BTCUSD, EURUSD, GBPUSD, XAUUSD, NAS100, and USDJPY. It is suitable for strategies involving breakout and scalping techniques.
Gösterge profili
Müşteri değerlendirmeleri
4.6
Değerlendirmeler: 3
5 | 67 % | |
4 | 33 % | |
3 | 0 % | |
2 | 0 % | |
1 | 0 % |
Müşteri değerlendirmeleri
October 27, 2025
Solid enough as a backup opinion. Win rate means less without average R.
October 22, 2025
it earns a spot because the trade idea gets a pause before execution. A clean signal can still fail.
October 19, 2025
The idea is fine, just do not expect it to print perfect entries, and The result needs a journal.
Tartışma
SSS
BTCUSD
Forex
Breakout
Indices
EURUSD
Commodities
GBPUSD
NZDUSD
Prop
Scalping
Crypto
Stocks
XAUUSD
NAS100
USDJPY
VWAP
cTrader Store üzerinden erişilebilen işlem botları, göstergeler ve eklentiler gibi ürünler, üçüncü taraf sağlayıcılar tarafından sağlanır ve yalnızca bilgilendirme ve teknik erişim amaçlarıyla sunulur. cTrader Store bir broker değildir ve yatırım tavsiyesi, kişisel öneriler vermez veya gelecekteki performansı garanti etmez.


!["High-Low Divergence [Iridio Capital]" logosu](https://cdn.ctrader.com/image/webp/443c4661-7abb-40f1-842f-4b6ec560649b_40914)


Fiyat
Başlangıç 25/09/2025
25
Satışlar
333
Ücretsiz yüklemeler