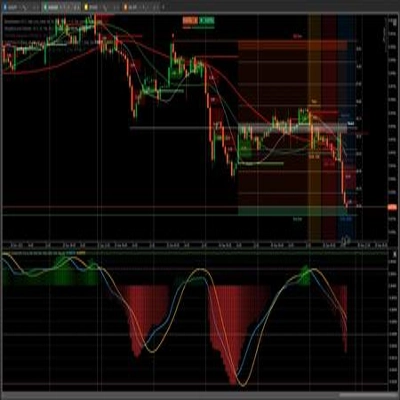
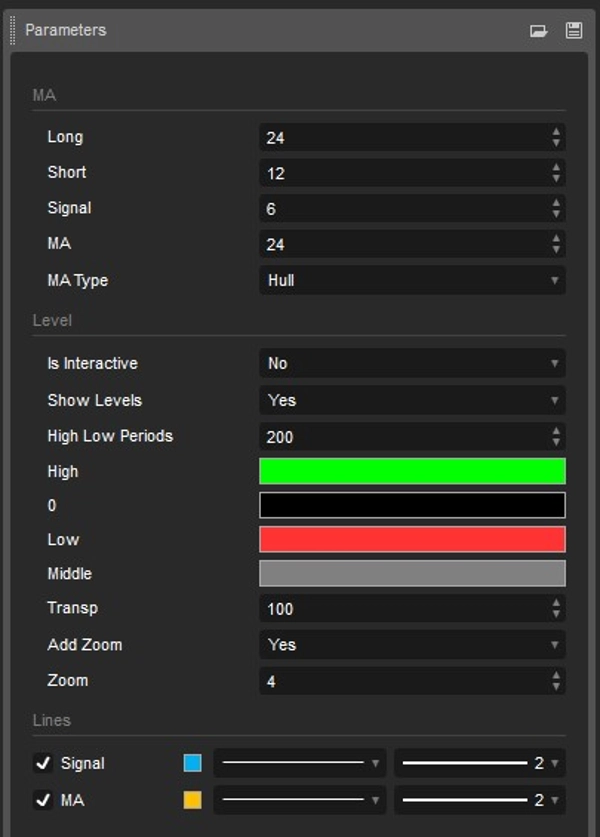
「MACD_Cross」ロゴ
MACD_Cross
「MACD_Cross」アップロード画像
135
販売
10.46K
無料インストール
Indicator profile
0.0
レビュー: 0
カスタマーレビュー
この商品にはまだレビューがありません。お使いになったことがある方は、ぜひレビューをお願いします。
MACD
Products available through cTrader Store, including trading bots, indicators and plugins, are provided by third-party developers and made available for informational and technical access purposes only. cTrader Store is not a broker and does not provide investment advice, personal recommendations or any guarantee of future performance.

この作成者の他の商品

「VWAP-Free」ロゴ
5.0
(2)
無料
VWAP only timeframe
😎Read the description before purchasing💩
This indicator consists of 3 moving averages that can be configured to your liking, from the type of moving average....
This technical analysis indicator provides information on market sentiment, trend and price levels....
This bot can automatically generate buy and sell orders based on three specific Fixed bugs.
😎Read the description before purchasing💩
「AllPattern」ロゴ
5.0
(2)
無料
🔍 Discover All Candlestick Patterns… Absolutely Free!
With this Fibonacci retracement indicator, traders have full control over the retracement levels displayed on the chart.
Session One is a tool for marking from to, useful if you've set the hours you want to trade
A straightforward yet effective tool signals entry points for both buying and selling. Include 3 Moving Average
The Parabolic SAR, or "Stop and Reverse," is a dynamic technical analysis tool.
🚀 HAI QUANTUM v4.0 | The Ultimate Quantum Terminal for cTrader (Smart Money & Algorithmic Trading)

これも好きかも

Yen Index
Identifies market compression zones and explosive Breakout moments using mathematical modeling.
All-in-one suite for ICT concepts: NY Midnight Open, Killzones, automatic Liquidity levels (PDH/L, PWH/L).
📈 Adaptive ALMA-Gaussian hybrid trend filter with precision smoothing and clear buy/sell signals.
Daily Pivot Points plots key support and resistance levels to guide precise trading decisions.
Volume for Renko/Range
Flags breakouts of recent highs/lows on cTrader charts. Shows arrows/lines. Optional trend filter & sound alerts 📉📈
The Structure Fractal indicator is designed to identify and visualize key market structure points
Auto-detect support and resistance & trendlines, highlight pullbacks/BOS retests, and filter with candle confirmation.
Auto-detects Bullish/Bearish Engulfing patterns to spot trend reversals. Real-time alerts, custom colors, all symbols.
Visualize market asymmetry like never before — steady climbs meet sudden drops with the Donchian PSAR
Candle Timer & Strength Panel DEMO for cTrader DEMO VERSION – 24 hours free trial! This is a DEMO version of the Candle
🧠Visually marks momentum zones when the RSI crosses the overbought/oversold thresholds (default 70/30). ✅
📈 Anchored VWAP with auto High/Low, session resets, Daily VWAP & TWAP — precise, Pine-accurate port.
Bring the RMA to cTrader! This is the Relative Moving Average from TradingView.
The ZigZag indicator is a technical analysis tool primarily used to identify key price reversal points.
🚀 Specialized algorithm is designed to confirm entry and exit points with precision 🎯
The purpose of the algorithm of the Boxify indicator is to try to put price action into zones, or better, boxes.
135
販売
10.46K
無料インストール