설명
스마트 캔들 델타 계산을 통한 전문 범위 기반 거래량 분석
정확한 거래량 분석의 힘을 열어보세요 RANGE DELTA CANDLE VOLUME PROFILE, cTrader용 궁극의 범위 기반 거래량 프로파일 지표입니다. 맞춤 시간 범위 전반에 걸쳐 유연하고 정확한 거래량 분석이 필요한 트레이더를 위해 설계되었으며, 지능적인 캔들 기반 델타 계산을 통해 기관 수준의 통찰력을 제공합니다.
🎯 주요 기능
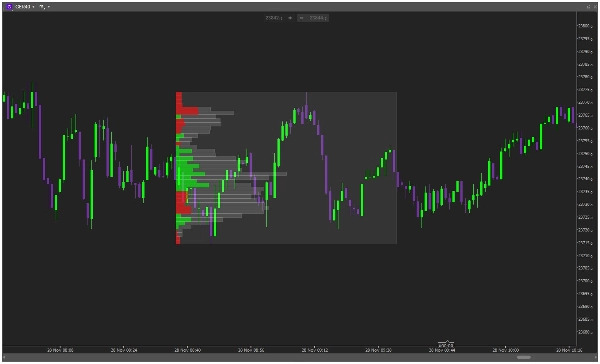
🏓 유연한 범위 고정
- 추세선을 사용하여 모든 맞춤 시간 범위 정의
- 선택한 지점 간 동적 프로파일 생성
- 시장 변화에 따른 실시간 업데이트
- 왼쪽 또는 오른쪽 고정 옵션
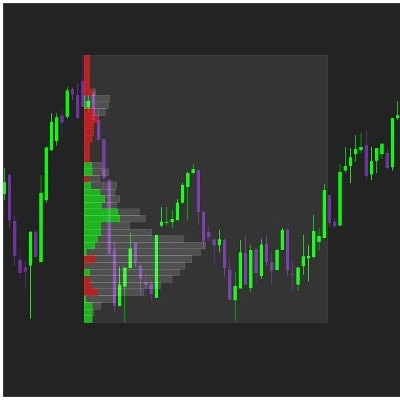
📊 스마트 캔들 기반 델타 분석
- 캔들 방향에 따른 고급 델타 계산
- 녹색 캔들 = 매수 거래량 | 빨간 캔들 = 매도 거래량
- 가격 수준별 깔끔하고 단일 색상 시각화
- 축적/분배 구역 즉시 식별
🎨 완전 맞춤형 표시
- 조정 가능한 빈/선 수 (5-100)
- 맞춤형 프로파일 너비 (범위의 5-300%)
- 매수/매도/총 거래량에 대한 완전한 색상 제어
- 투명도 및 불투명도 설정
⚡ 이중 표시 모드
- 델타 모드: 순매수/매도 압력 시각화
- 거래량 모드: 전통적인 거래량 프로파일 표시
- 왼쪽 또는 오른쪽 고정 선택 가능
🚀 트레이더들이 선택하는 이유
"어떤 맞춤 범위든 분석할 수 있는 유연성은 게임 체인저입니다. 세션 분석과 주요 시장 움직임에 완벽합니다." - 전문 데이 트레이더
"마침내 실제로 의미 있는 범위 거래량 프로파일이 나왔습니다. 캔들 기반 델타는 매우 정확합니다." - 스윙 트레이더
📈 이상적인 용도
- 세션 분석 - 특정 거래 세션(런던, 뉴욕, 아시아) 분석
- 이벤트 기반 거래 - 뉴스 이벤트 및 경제 데이터 주변 거래량 연구
- 기술적 분석 - 거래량 검증을 통한 지지/저항 확인
- 시장 구조 - 가치 영역 및 거래량 갭 식별
🛠 사용하기 간단함
- 추세선 그리기 시작점과 끝점 사이에
- 관찰하기 거래량 프로파일이 자동으로 생성되는 것을
- 분석하기 맞춤 범위 전반의 델타 분포
- 거래하기 거래량 확인된 수준과 통찰력으로
🔧 기술 사양
- 실시간 계산 및 업데이트
- 낮은 자원 소비
- 모든 타임프레임과 호환
- 모든 거래 도구와 작동
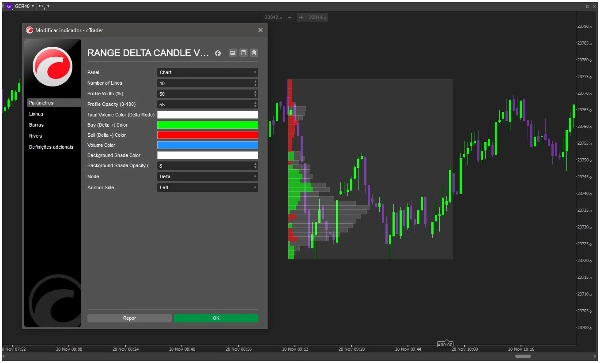
📋 맞춤 설정 옵션
- 빈/선 수
- 프로파일 너비 백분율
- 불투명도 조절 (0-100%)
- 맞춤 색상 구성표
- 고정 측면 선택 (왼쪽/오른쪽)
- 표시 모드 (델타/거래량)
🎯 오늘 바로 시장 분석을 향상하세요!
전 세계 전문 트레이더들과 함께 RANGE DELTA CANDLE VOLUME PROFILE로 시장 분석을 혁신하세요. 경직된 고정 범위 도구 사용을 중단하고 필요한 곳에서 정확하게 거래량을 분석하세요.
⭐ "정확한 델타 계산으로 맞춤 범위를 분석할 수 있는 능력은 시장 구조 접근 방식을 완전히 바꿨습니다. 필수 도구!"
오늘 바로 cTrader 플랫폼에 RANGE DELTA CANDLE VOLUME PROFILE을 추가하고 모든 시장 상황에서 거래량 분석을 마스터하세요!
🆚 다른 거래량 프로파일보다 이것을 선택해야 하는 이유?
- ✅ 진정한 유연성 - 모든 맞춤 시간 범위 분석
- ✅ 정확한 델타 - 신뢰할 수 있는 결과를 위한 캔들 기반 계산
- ✅ 전문가 수준의 시각화 - 깔끔하고 기관급 표시
- ✅ 진정한 맞춤화 - 모든 시각적 요소에 대한 완전한 제어
- ✅ 검증된 방법론 - 전문 거래 원칙 기반
유연한 범위 기반 거래량 프로파일링의 힘으로 차트 분석을 혁신하세요!


!["[Stellar Strategies] Inside Bar with Signals" 로고](https://cdn.ctrader.com/image/webp/1d9e8bfa-3b2c-4440-bb37-5856902008a7_30683)


