
Descripción
El concepto de "Ingeniería Inversa"
La principal innovación de este indicador radica en su algoritmo de Ingeniería Inversa. Normalmente, un oscilador estocástico toma datos de precios y los transforma en un número entre 0 y 100. Este indicador hace lo contrario: toma los niveles matemáticos del oscilador y los reproyecta de nuevo en la escala de precios.
Esto permite al trader traducir un impulso matemático en un nivel de precio concreto ($ o pips) directamente en el gráfico.
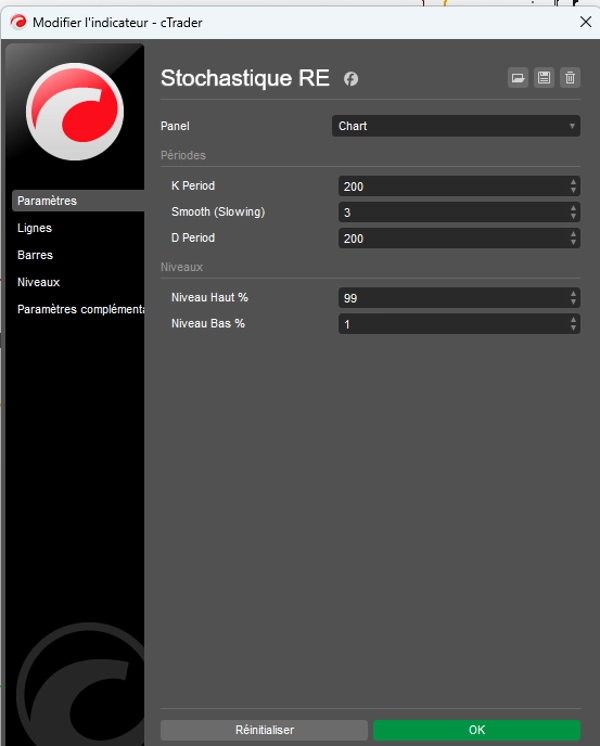
Definiendo límites: el techo (99%) y el suelo (1%)
A diferencia de las configuraciones clásicas (80/20), este indicador está configurado por defecto en 1% y 99%. Esta configuración tiene un propósito específico: define los límites físicos del precio.
- El nivel del 99% (techo del precio): Define el precio más alto que el mercado puede alcanzar antes de considerarse que ha agotado el 99% de su amplitud de movimiento durante el período dado. Es la "frontera" del precio.
- El nivel del 1% (suelo del precio): Define el precio más bajo, el soporte último del ciclo actual. Es el nivel donde el precio ha agotado el 99% de su capacidad descendente en relación con su historia reciente.
¿Por qué "define el precio"?
Gracias a este sistema, la línea Señal Naranja %D ya no es solo una curva que se mueve en el vacío.
- Localización del precio: Muestra la ubicación exacta del "precio justo" ponderado por su impulso.
- Mapeo del rango: Transforma el gráfico en un mapa donde puedes ver si el precio actual "vale" el 1% o el 99% de su potencial.
- Objetivos concretos: Si la línea naranja sube, no solo busca alcanzar "80"; busca alcanzar el precio preciso mostrado por la línea roja (99%).
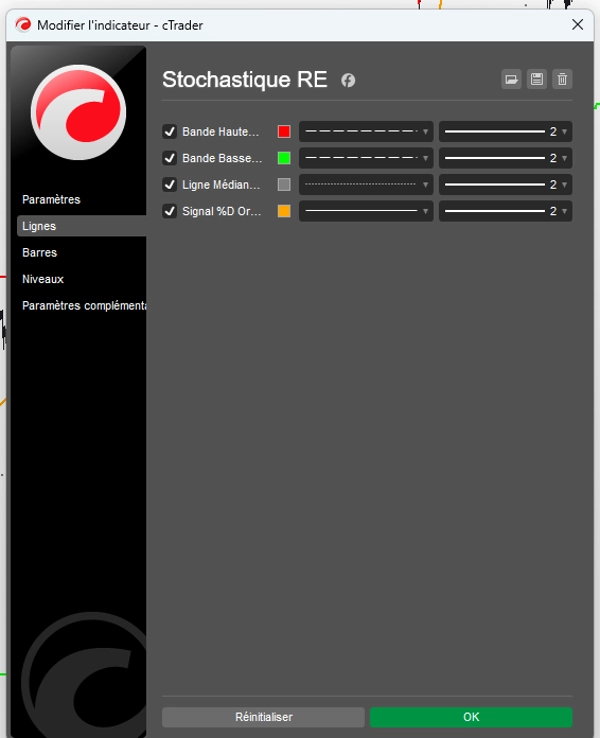
Funciones de las líneas (pestaña Líneas)
Todo es personalizable para una lectura visual instantánea:
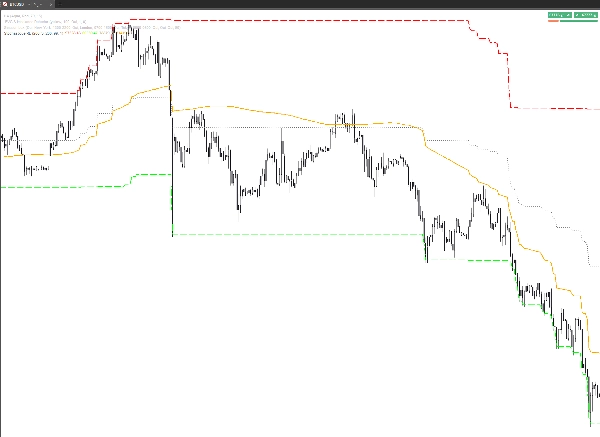
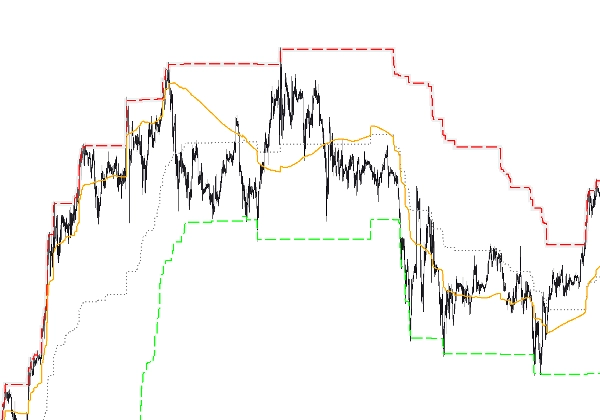
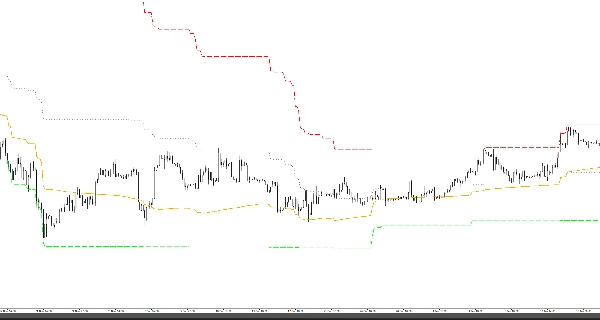
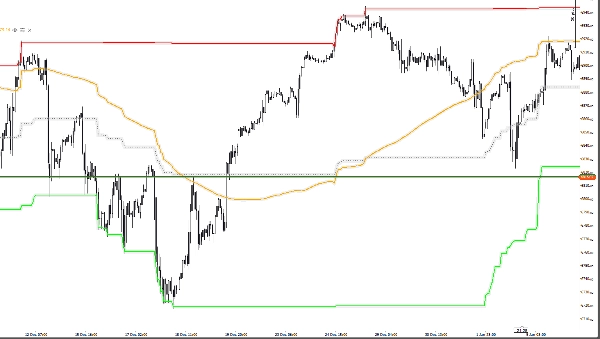
- Banda superior (99%): El techo teórico del precio.
- Banda inferior (1%): El suelo teórico del precio.
- Línea media (50%): El punto pivote central, la zona de equilibrio.
- Señal Naranja %D: El cursor dinámico que navega entre el suelo y el techo para definir la dirección del mercado.
Resumen para el trader
Este indicador no solo te dice que el mercado está "sobrecomprado"; te muestra exactamente a qué precio el mercado se vuelve físicamente demasiado caro (99%) o demasiado barato (1%). Es una herramienta de precisión que devuelve las matemáticas a la realidad del libro de órdenes.
Resumen
The indicator displays these boundaries directly on the price chart, allowing traders to see exact price levels where the market is considered overbought or oversold. Key features include customizable lines for the upper band (99%), lower band (1%), mid line (50%), and an orange signal %D line that dynamically indicates market direction between these boundaries.
By translating momentum into precise price targets, Stochastique RE helps traders localize fair price zones, map price ranges, and identify concrete price targets rather than abstract oscillator values. It supports various markets including Forex, stocks, commodities, indices, and cryptocurrencies, with symbol tags such as BTCUSD, EURUSD, GBPUSD, XAUUSD, NAS100, and USDJPY.
Valoraciones de clientes
5 | 67 % | |
4 | 33 % | |
3 | 0 % | |
2 | 0 % | |
1 | 0 % |


