Açıklama
KST Momentum Heatwave — Momentumu Piyasa Sıcaklığına Dönüştürün (Grafikte)
✅ Modern KST motoru optimize edilmiş varsayılanlarla (10/15/20/30 + 10/10/10/15, Sinyal 9)
✅ Gerçek fiyat örtüsü — KST + Sinyal doğrudan bir temel EMA etrafında grafiğe yansıtılır
✅ 4 Görsel Mod: Pro Smooth / Klasik / Ham Isı / İki Katman
✅ Momentum Isı Haritası + Parlama gücü anında görselleştirmek için
✅ Semboller ve zaman dilimleri arasında tutarlılık için normalize edilmiş momentum gücü
✅ Yanlış sinyalleri önleyen histerezis sistemi yatay piyasalardaki gürültüyü filtrelemek için
Bu geleneksel bir osilatör değildir.
KST Momentum Heatwave klasik Know Sure Thing (KST) göstergesini doğrudan grafiğinize entegre edilmiş bir görsel momentum sıcaklık sistemine dönüştürür.
Grafiğin altındaki bir osilatörü izlemek yerine, momentum fiyat üzerinde dinamik bir katman haline gelir — yönü, gücü ve momentum döngüsünü anında yorumlanabilir şekilde gösterir.
Gösterge ne yapar ve ne için tasarlanmıştır
KST Momentum Heatwave momentum verilerini piyasa baskısının görsel sıcaklık haritasına dönüştürür.
Geleneksel osilatörler, traderların fiyat grafiği ile ayrı bir gösterge penceresi arasında sürekli dikkat değiştirmesini gerektirir.
Bu gösterge, momentumu doğrudan fiyat grafiğinin üzerine yansıtarak bu sürtüşmeyi ortadan kaldırır.
Sonuç, hemen görebileceğiniz daha temiz bir iş akışıdır:
- momentumun hızlandığı
- bir trendin güçlü ve baskın olduğu
- momentumun soğuduğu
- piyasanın düşük enerjili dalgalanma aşamasına girdiği
Hızla tanımlamak isteyen traderlar için tasarlanmıştır:
- trend gücü
- momentum devam fırsatları
- momentum tükenmesi
- rejim değişimleri
Bir hareketin arkasında güç olup olmadığını tahmin etmek yerine, KST Momentum Heatwave bu baskıyı görünür kılar.
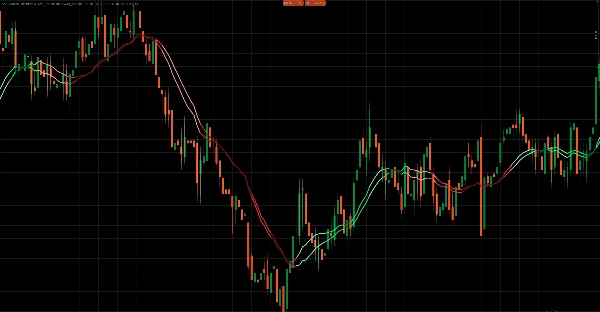
Grafikte neyi gösterir ve nasıl okunur
Gösterge, iki momentum çizgisini doğrudan fiyat grafiğine ve görsel bir ısı katmanını çizer.
1. KST Çizgisi — Momentum Çekirdeği
Dört ağırlıklı ROC bileşeninden hesaplanan ana momentum çizgisi.
Yorumlama:
- KST Sinyalin üzerinde → yükseliş momentumu
- KST Sinyalin altında → düşüş momentumu
İki çizgi arasındaki mesafe momentum yoğunluğunu gösterir.
2. Sinyal Çizgisi — Momentum Tetikleyicisi
KST çizgisinin yumuşatılmış hareketli ortalaması.
Bu, momentum tetikleyici çizgisi olarak görev yapar.
- KST ile Sinyal arasındaki kesişmeler genellikle momentum değişimlerini veya hızlanmalarını gösterir.
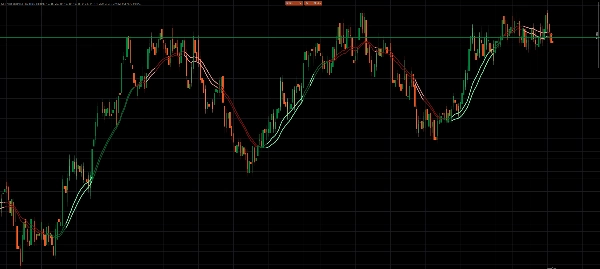
3. Momentum Isı Katmanı
Gösterge, KST ile Sinyal arasındaki mesafeyi 0 ile 1 arasında normalize edilmiş bir güç değerine dönüştürür.
Bu değer, renk yoğunluğu ve ısı haritası görselleştirmesini yönlendirir.
Yorumlama:
- Parlak/açık renkler → güçlü momentum
- Normal renkler → stabil trend baskısı
- Koyu renkler → zayıflayan momentum
- Soluk renkler → potansiyel yavaşlama veya geçiş
İsteğe bağlı ısı haritası ve parlama efektleri mumları boyar, böylece traderlar piyasanın “ısındığını” anında görebilir.
4. Fiyat Projeksiyon Katmanı
Ham osilatör değerleri yerine, gösterge momentumu fiyata yansıtır:
- bir temel EMA
- bir ATR ölçekli genlik
Bu, örtünün grafiğe orantılı kalmasını sağlar ve göstergenin farklı piyasalarda ve zaman dilimlerinde okunabilirliğini korur.
Görsel modlar ve davranış
KST Momentum Heatwave, momentumu yorumlama şeklini değiştiren dört görsel stil içerir.
Pro Smooth
En gelişmiş mod.
Özellikler:
- yaşam döngüsüne dayalı momentum renklendirmesi
- histerezis filtresi
- yön değişimlerinden önce onay gereksinimleri
Bu, yatay veya dalgalı piyasalardaki gürültüyü önemli ölçüde azaltır.
Klasik
Histerezis filtresi olmadan yaşam döngüsü renklendirmesi kullanır.
Sonuç:
- daha hızlı momentum tepkileri
- piyasa dalgalanmalarına biraz daha hassas
En çok gün içi ve swing trading için uygundur.
Ham Isı
Tamamen mutlak momentum gücüne odaklanır.
Momentum üç katmana ayrılır:
- güçlü
- orta
- zayıf
Bu mod, saf momentum gücü okumak isteyen traderlar için idealdir.
İki Katman
Basitleştirilmiş bir yorumlama modu.
- KST Sinyalin üzerinde/altında yönü belirler
- bir güç eşiği güçlü ve zayıf momentum olarak tanımlar
Minimal görsel karmaşıklığı tercih eden traderlar için tasarlanmıştır.
KST Momentum Heatwave nasıl kullanılır
Adım 1 — Görsel modunuzu seçin
Ticaret tarzınıza uygun modu kullanın:
- Pro Smooth → gürültülü piyasalarda en temiz sinyaller
- Klasik → daha hızlı tepkiler
- Ham Isı → momentum gücüne odaklanma
- İki Katman → basit güçlü ve zayıf yorumlama
Adım 2 — Momentum rejimini belirleyin
Baskın renk davranışını arayın:
- Yükseliş renkleri baskın → uzun pozisyon eğilimi
- Düşüş renkleri baskın → kısa pozisyon eğilimi
- Koyu soluk renkler → momentum zayıflıyor
- Sık renk değişimleri → muhtemelen yatay piyasa koşulları
Adım 3 — İşlem zamanlaması için momentumu kullanın
Tipik kullanım durumları şunlardır:
Trend devamı
Momentum rejimi sağlam kaldığında ve güç yüksek olduğunda geri çekilmelerde giriş yapın.
Momentum tükenmesi
Renkler koyulaşıp güç azaldığında pozisyonu azaltın.
Momentum dönüşü
KST/Sinyal değişimleri ve artan güç için izleyin.
Örnek önerilen ayar
Çoğu piyasa için dengeli bir yapılandırma:
Ön ayar: Swing_Classic
Görsel Mod: Pro Smooth
Temel EMA: 34
ATR Periyodu: 14
ATR Genliği: 1.40
Normalize Geriye Bakış: 200
Isı Haritası: Etkin
Parlama: Etkin
Önerilen piyasalar ve zaman dilimleri
Gösterge ATR ölçeklendirmesi ve normalize güç kullandığından, çoğu piyasaya iyi uyum sağlar.
Özellikle iyi çalışır:
Forex
- Gün içi işlem için M5 – H1
- Swing trading için H1 – H4
Endeksler
- Momentum scalping için M1 – M15
- Yapılandırılmış trend ticareti için M15 – H1
Kripto
- M5 – H1 (Pro Smooth önerilir)
- Trend ortamları için H1 – H4
Emtialar
- M15 – H4
Daha düşük zaman dilimleri en çok Pro Smooth filtrelemesinden faydalanır.
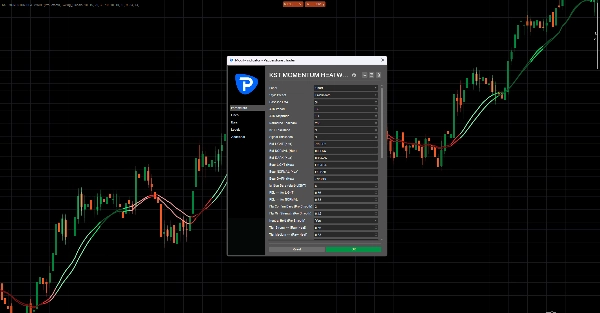
Ana parametreler ve kontrol ettikleri
Ön ayar sistemi
Scalp_Clean, Swing_Classic, Smooth ve Aggressive ön ayarları iç KST yapılandırmasını ayarlar.
Özel mod tam manuel kontrol sağlar.
Momentum normalizasyonu
Normalize Geriye Bakış
Momentum gücünü ölçeklendirmek için kullanılan tarihsel pencereyi kontrol eder.
Daha yüksek değerler daha yumuşak okumalar üretir.
Örtü projeksiyonu
Temel EMA
Momentum örtüsünü yansıtmak için kullanılan ankraj çizgisini tanımlar.
ATR Genliği
Örtünün temel çizgiden ne kadar genişleyeceğini kontrol eder.
Yanlış sinyal kontrolü (Pro Smooth)
Flip Onay Çubukları
Bir rejim değişikliğini onaylamak için gereken çubuk sayısı.
Flip Min Gücü
Bir dönüşü kabul etmeden önce gereken minimum momentum gücü.
Nötr Tutma
Zayıf momentum koşullarında rejimi stabilize etmeye yardımcı olur.
Isı ve parlama görselleştirmesi
Isı haritasının momentum gücüne ne kadar güçlü tepki verdiğini kontrol eder.
Parametreler şunları içerir:
- Isı Genişliği
- Isı Alfa
- Isı Gama
- Parlama Gücü
Performans yönetimi
Kalan Çubuklar
Göstergeyi sorunsuz çalıştırmak için grafikte kalan görsel nesne sayısını sınırlar.
Önemli notlar
Grafik nesnesi yoğunluğu
Isı haritası ve parlama efektleri birden fazla nesne çizer.
Performans yavaşlarsa:
- Kalan Çubukları azaltın
- Isı Genişliğini azaltın
- Parlamayı devre dışı bırakın
Güç doygunluğu
Aşırı volatilite ani yükselişleri gücü hızla maksimuma yakınlaştırabilir.
Böyle bir durum olursa:
- Normalize Geriye Bakışı artırın
- Pro Smooth moduna geçin
Yapı ile birlikte en iyi şekilde kullanılır
KST Momentum Heatwave, bağımsız bir giriş üreticisi değil, bir momentum rejim katmanı olarak tasarlanmıştır.
En iyi sonuçlar için şunlarla birleştirin:
- destek ve direnç
- piyasa yapısı
- likidite bölgeleri
- trend analizi


