


Opis
TeoriaCutrim to statystyczny wskaźnik nakładkowy zaprojektowany do ilościowego określania ostatnich zachowań rynku poprzez analizę rozkładu świec i zmienności. Zamiast przewidywać kierunek, dostarcza obiektywne dane o tym, co rynek właśnie zrobił w konfigurowalnym oknie świec.
Analizowane dane rynkowe
Wskaźnik ocenia zdefiniowaną przez użytkownika liczbę ostatnich świec (okres analizy wstecznej) i wyodrębnia:
- Liczbę i procent świec byczych (zamknięcie > otwarcie)
- Liczbę i procent świec niedźwiedzich (zamknięcie < otwarcie)
- Różnicę między dominacją byków a niedźwiedzi
- Średni zakres świecy (w pipsach)
- Zakres bieżącej świecy (w pipsach)
- Całkowity zakres cenowy w analizowanym oknie
Wizualny wynik i interpretacja
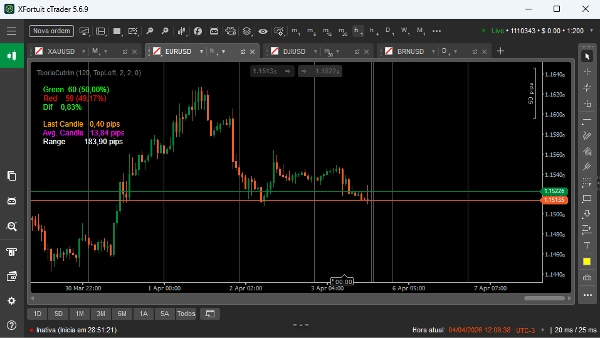
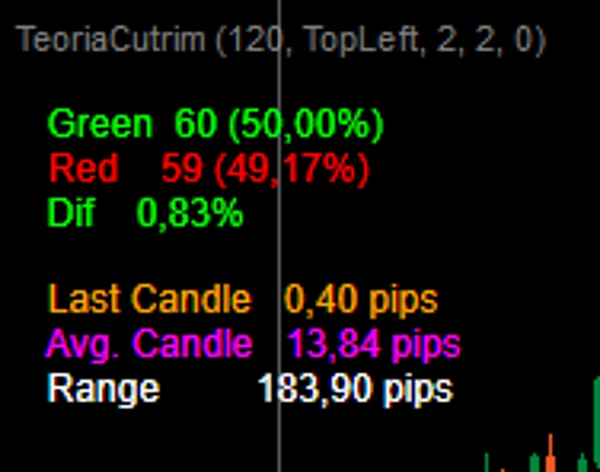
Wskaźnik wyświetla kluczowe metryki bezpośrednio na wykresie:
- Zielony: łączna liczba świec byczych i procent
- Czerwony: łączna liczba świec niedźwiedzich i procent
- Różnica: bezwzględna różnica między procentami byków i niedźwiedzi
- Ostatnia świeca: bieżący rozmiar świecy w pipsach
- Śr. świeca: średni rozmiar świec w wybranym oknie
- Zakres: odległość między najwyższym maksimum a najniższym minimum w oknie
Interpretacja jest prosta:
- Większa liczba świec byczych sugeruje niedawny presję wzrostową
- Większa liczba świec niedźwiedzich sugeruje niedawny presję spadkową
- Niska różnica (Różnica) wskazuje na równowagę lub losowość
- Rosnący średni rozmiar świecy wskazuje na rosnącą zmienność
- Duży całkowity zakres sugeruje ekspansję rynku, podczas gdy mały zakres sugeruje kompresję
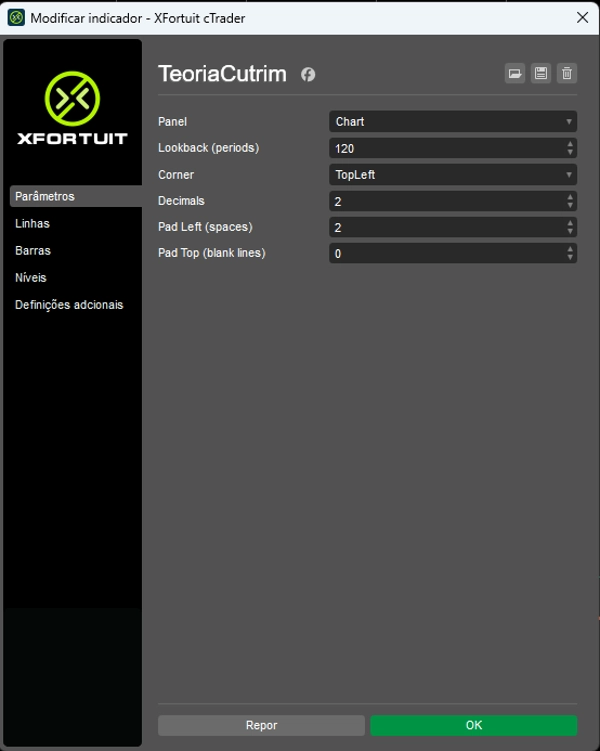
Kluczowe parametry
- Okres analizy wstecznej: liczba świec używanych do analizy (w pełni regulowana)
- Róg: pozycja wyświetlania danych na ekranie
- Miejsca dziesiętne: liczba wyświetlanych miejsc po przecinku
- Odstęp z lewej / Odstęp z góry: wizualne dostosowania odstępów
Przypadki użycia
TeoriaCutrim najlepiej stosować jako narzędzie kontekstowe, a nie generator sygnałów. Typowe zastosowania obejmują:
- Pomiar statystycznej nierównowagi przed wejściem w transakcje
- Identyfikacja ekspansji lub kurczenia się zmienności
- Filtrowanie transakcji na podstawie ostatniego zachowania świec
- Wsparcie strategii ilościowych lub opartych na prawdopodobieństwie
Docelowy użytkownik
Ten wskaźnik jest przeznaczony dla traderów, którzy polegają na danych, statystykach i obiektywnej analizie, a nie na subiektywnym rozpoznawaniu wzorców. Odpowiedni zarówno dla traderów dyskrecjonalnych, jak i systematycznych.
Podsumowanie
Dyskusja
Opinie klientów
Częste pytania

![Logo „[Stellar Strategies] Wave Trend Pro”](https://cdn.ctrader.com/image/webp/5f226fbb-245a-41cd-9cdd-b018257d5e6d_28617)















Cena