present
Kaydolun ve ilk alışverişinizde $50 indirim kazanın
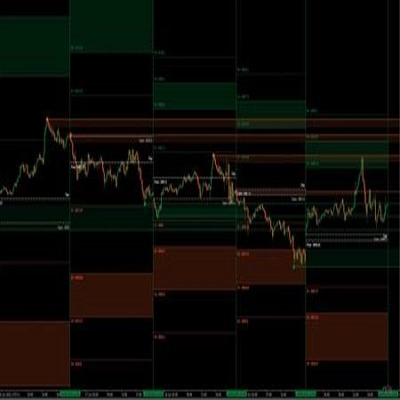
Trading product for MyZtrade W1 MN zones Gösterge EMA Supertrend, image 1
MyZtrade W1 MN zones
Gösterge
Sürüm 1.0, Aug 2026
Windows, Mac
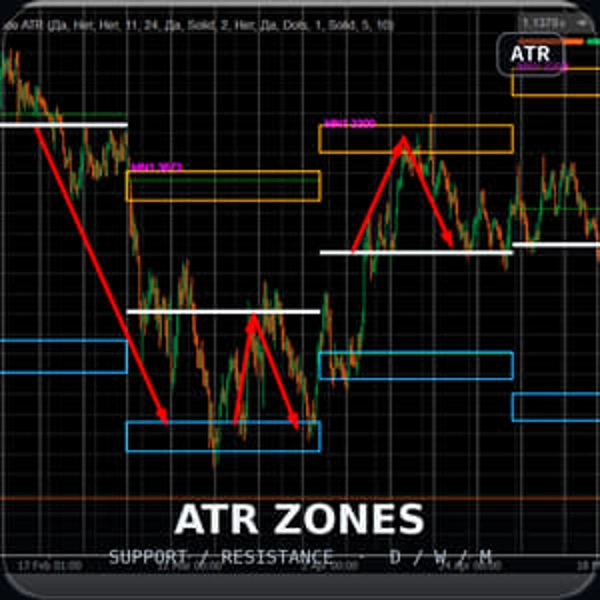
Trading product for MyZtrade W1 MN zones Gösterge EMA Supertrend, image 2
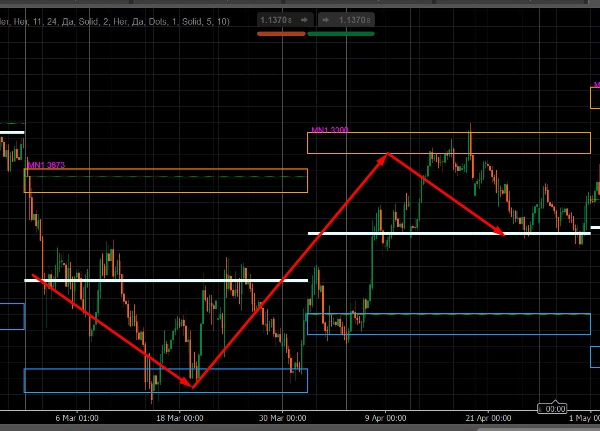
Trading product for MyZtrade W1 MN zones Gösterge EMA Supertrend, image 3
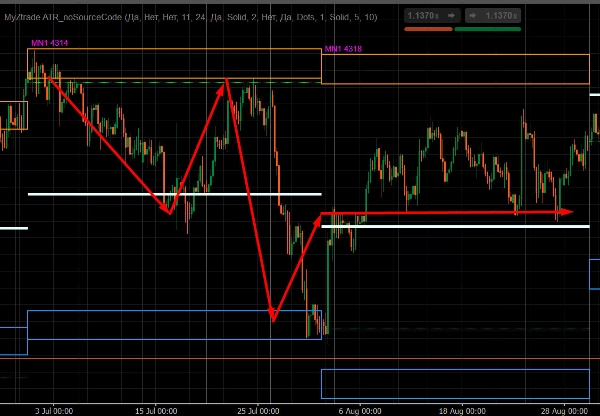
Trading product for MyZtrade W1 MN zones Gösterge EMA Supertrend, image 4
Trading product for MyZtrade W1 MN zones Gösterge EMA Supertrend, image 5
Başlangıç 28/06/2025

Açıklama

MyZtrade MTF ATR Bölgeleri — Çok Zaman Dilimli ATR Tabanlı Destek ve Direnç Bölgeleri

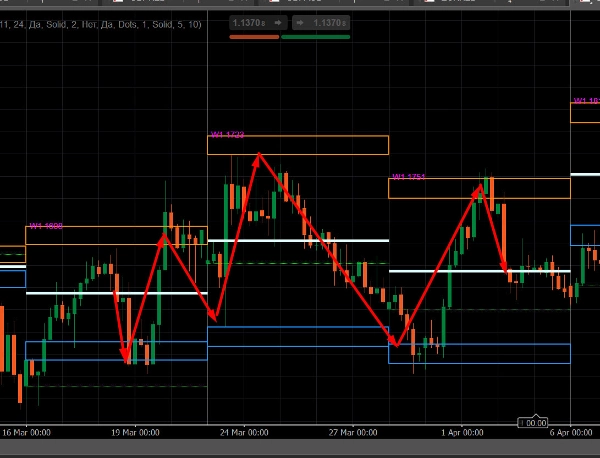
Bu gösterge, grafiğin kendi zaman diliminden bağımsız olarak, daha yüksek zaman dilimi çubuklarının ortalama Yüksek–Düşük aralığına — Aylık, Haftalık ve Günlük — dayalı potansiyel dönüş bölgeleri (destek/direnç) çizer.


Ne Yapar


Etkinleştirilen her zaman dilimi için (Aylık / Haftalık / Günlük), gösterge:


• O zaman dilimindeki en son belirli sayıda çubuk üzerinde ortalama aralığı (Yüksek–Düşük) hesaplar (varsayılan: 11 çubuk)


• Bu ortalama aralığın değeri kadar her çubuğun yüksek/düşüğünden ofsetlenmiş dikdörtgen şeklinde direnç ve destek bölgeleri çizer


• Her bölgeyi, puan cinsinden volatilite değeri ve zaman dilimi ön eki ile etiketler (örneğin, MN1 2696, W1 1180, D1 340) — birden fazla zaman dilimi aynı anda etkinleştirildiğinde faydalıdır


• Ayrıca çubuğun açılış fiyatı çizgisini ve bölge içindeki medyan çizgiyi çizer


• Henüz kapanmamış mevcut çubuğu ayrı olarak takip eder — çubuğun gelişimine göre bölgesi gerçek zamanlı hareket eder


Ana Özellikler


• Birden fazla zaman dilimi aynı anda — Aylık, Haftalık ve Günlük birbirinden bağımsız olarak etkinleştirilebilir


• Grafiğin zaman dilimine bağlı değil — saatlik grafikte aylık bölgeleri görüntüleyebilirsiniz, vb.


• Tamamen özelleştirilebilir görünüm — renkler, çizgi kalınlığı ve stili, bölge dolgu/çizgisi, metin boyutu


• Görsel bir rehber olarak hizmet eder; ticaret sinyalleri üretmez ve giriş/çıkış mantığı içermez

Özet

YZ özeti
MyZtrade W1 MN zones is a multi-timeframe indicator that identifies potential reversal zones of support and resistance on trading charts. It calculates the average range (High–Low) over a configurable number of recent bars (default 11) for selected higher timeframes—Monthly, Weekly, and Daily—regardless of the chart’s current timeframe. The indicator then plots rectangular zones offset from each bar’s high and low by this average range, visually marking areas where price reversals may occur.

Each zone is labeled with its volatility value in points and the corresponding timeframe prefix (e.g., MN1, W1, D1) to distinguish multiple enabled timeframes. Additional visual elements include the bar’s opening price line and a median line within each zone. The indicator also tracks the current, developing bar in real time, updating its zone dynamically.

Key features include simultaneous display of multiple timeframes, full customization of visual appearance (colors, line styles, text size), and independence from the chart’s timeframe, allowing monthly zones to be viewed on intraday charts. This tool serves as a visual guide for support and resistance levels based on volatility but does not provide trading signals or entry/exit logic.
Gösterge profili

Müşteri değerlendirmeleri

0.0
Değerlendirmeler: 0
Müşteri değerlendirmeleri
Bu ürün için henüz bir değerlendirme yok. Ürünü denediniz mi? O zaman ona dair görüşlerini paylaşan ilk kişi olun!

Tartışma

SSS

EMA
Supertrend
Supply & Demand
ATR
Moving Average
VWAP
Support & Resistance
cTrader Store üzerinden erişilebilen işlem botları, göstergeler ve eklentiler gibi ürünler, üçüncü taraf sağlayıcılar tarafından sağlanır ve yalnızca bilgilendirme ve teknik erişim amaçlarıyla sunulur. cTrader Store bir broker değildir ve yatırım tavsiyesi, kişisel öneriler vermez veya gelecekteki performansı garanti etmez.

Bu oluşturanın diğer ürünleri

Gösterge
Volume
Key Levels
+4
Margin Zones its CME-based support/resistance levels from price extremes, helps traders spot entries and exits NKZ zones
Gösterge
Channel
Fibonacci
+5
Market maker levels from key price extremes — catch major reversals and corrections in one click. ver1.2
Gösterge
BOS
CHOCH
+5
MyZTrade High TF candle is a multi-timeframe visualisation tool that overlays completed higher-timeframe candles.

Şunları da beğenebilirsiniz

Gösterge
Forex
BTCUSD
+10
🎯Smart Signals : Auto Buy/Sell alerts with dynamic TP/SL algorithm. 💡
Gösterge
BOS
MSS
+3
Orderblocks with Multi-Timeframe.
Gösterge
RSI
BTCUSD
+5
Identify market structure effortlessly with swing highs, lows, CHoCH, and BOS levels for smart trading decisions! 📊🔍"
Gösterge
Doji
Engulfing
+3
Multi Timeframe OHLC levels (daily, weekly, and monthly), with a two-day price action bias dashboard
Gösterge
The Advanced Volume Profile Indicator calculates POC, Median, and Mode, revealing key price levels for smarter trading.
"Index Hunter" logosu
En yüksek puanlı
4.7
(4)
$20
/
$40
Gösterge
AI
ATR
+9
Index Hunter: Momentum analysis for US30 & NAS100. Designed to identify high-velocity moves and intraday trends.
Gösterge
AI
ATR
+19
QX SessionBox ORB: Session boxes + ORB levels + clean dashboard with optional closed-candle breakout signals.
Gösterge
EMA
AI-assisted
+1
Multi EMA Timeframes lets you stay on your chart and see the exact EMA from any timeframe you choose — up to 5 at once.
Gösterge
BOS
CHOCH
+3
Identifies HH, HL, LH, and LL swing points using fractals. Essential for Smart Money Concepts and price action.
"KANDIKA HEAT MAP" logosu
En yüksek puanlı
4.6
(5)
$19
Gösterge
Color-Based Market Pressure & Volatility Visualizer The Kandika Heatmap Indicator
Gösterge
ATR
Forex
+5
🚀 Buy and sell signals 📈📉 only when three independent engines agree simultaneously.
Gösterge
ATR
RSI
+5
Delta RSI Candle Pro, the indicator that transforms ordinary candlesticks into powerful momentum visualizers.
Gösterge
EMA
VWAP
+2
ORB Range Indicator maps the opening range and gives a practical session-breakout workflow with clear labels.
Gösterge
ATR
Volume
+5
Order blocks with measured hold-rate stats and confidence scoring — not just zones on a chart.
Gösterge
Forex
BTCUSD
+10
Trend-following channel using dual MAs with visual cloud and optional alerts on crossovers
Gösterge
Forex
Crypto
+3
Consecutive Series Moves — Reveal the True Pulse of Price Action
"Dem" logosu
En yüksek puanlı
4.2
(4)
$20
Gösterge
Forex
BTCUSD
+5
Scalping indicator for Renko 100 using EMAs to show trend and entry zones with clear colored rectangles.
Gösterge
BOS
CHOCH
+5
A professional-grade cTrader indicator for traders following the Inner Circle Trader (ICT) methodology.

Fiyat

Başlangıç 28/06/2025