
Opis
Czym jest LTtradingBox?
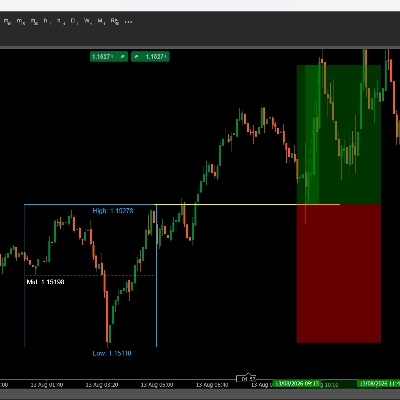
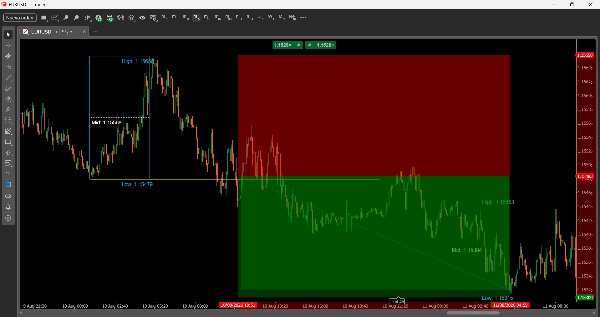
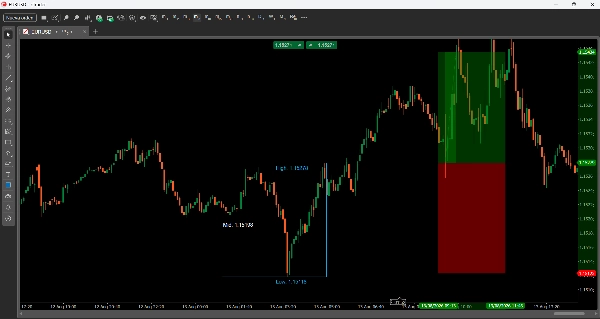
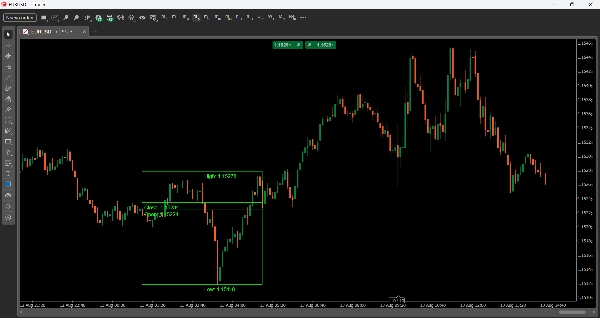
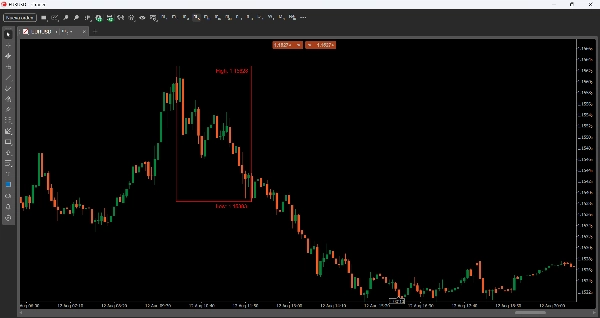
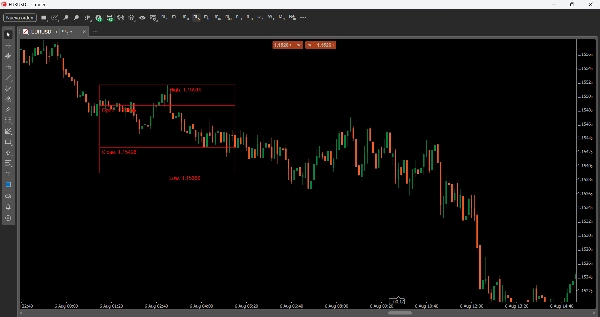
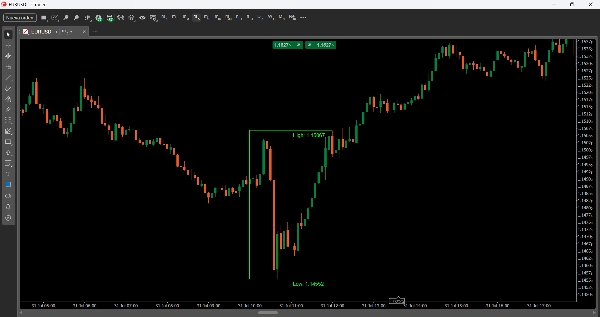
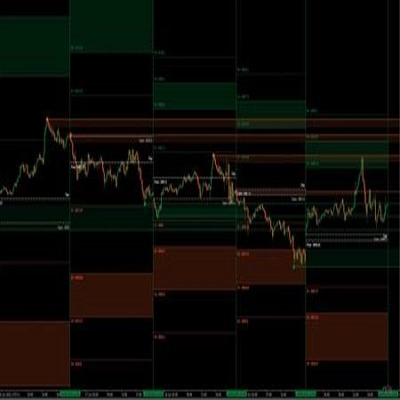
LTtradingBox wizualnie zaznacza zakres cenowy (maksimum, minimum, otwarcie i zamknięcie) wybranego przez Ciebie okna czasowego — na przykład sesji londyńskiej lub nowojorskiej. Ramka automatycznie zmienia kolor w zależności od wyniku tej sesji: zielony, jeśli zakończyła się wzrostowo, czerwony, jeśli zakończyła się spadkowo, szary, jeśli neutralnie (lub dowolne kolory wybrane przez Ciebie dla każdego przypadku). Dodaje także linie odniesienia (Mid Price, Mid Time) oraz opcjonalne wypełnienie wizualne, co pomaga szybko dostrzec strefy płynności, zakresy akumulacji i kluczowe poziomy do handlu.
Parametry
Ustawienia czasu
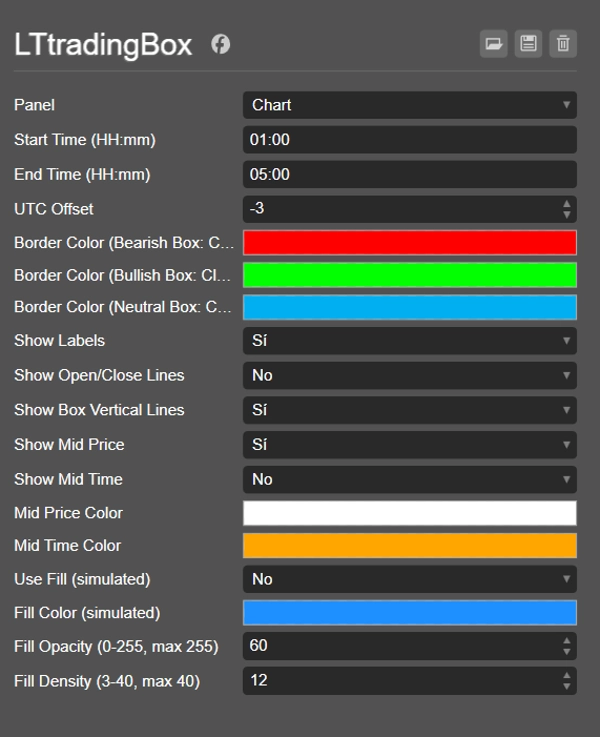
- Czas rozpoczęcia (HH:mm) — Czas rozpoczęcia ramki (format 24-godzinny).
- Czas zakończenia (HH:mm) — Czas zakończenia ramki.
- Przesunięcie UTC — Korekta czasu, aby ramka była zgodna z Twoją lokalną strefą czasową lub sesją, którą chcesz śledzić (np. Londyn, NY, Azja), niezależnie od strefy czasowej Twojego brokera.
Kolory
- Kolor obramowania (Ramka spadkowa: Zamknięcie < Otwarcie) — Kolor obramowania, gdy ramka zamyka się spadkowo.
- Kolor obramowania (Ramka wzrostowa: Zamknięcie > Otwarcie) — Kolor obramowania, gdy ramka zamyka się wzrostowo.
- Kolor obramowania (Ramka neutralna: Zamknięcie == Otwarcie) — Kolor obramowania, gdy zamknięcie równa się otwarciu.
Opcje wyświetlania
- Pokaż etykiety — Przełącza wyświetlanie etykiet tekstowych pokazujących wartości Maksimum, Minimum, Otwarcia i Zamknięcia.
- Pokaż linie otwarcia/zamknięcia — Rysuje poziome linie oznaczające cenę otwarcia i zamknięcia wewnątrz ramki.
- Pokaż pionowe linie ramki — Włącza pełny prostokąt (4 obramowania); jeśli wyłączone, pokazane są tylko linie Maksimum i Minimum.
- Pokaż Mid Price — Rysuje linię przerywaną na środku między Maksimum a Minimum.
- Pokaż Mid Time — Rysuje pionową linię na środku ramki w czasie.
- Kolor Mid Price / Kolor Mid Time — Kolory do personalizacji tych linii.
Wypełnienie (wypełnienie wizualne)
- Użyj wypełnienia (symulowane) — Włącza symulowane wypełnienie wewnątrz ramki (za pomocą nakładających się cienkich linii).
- Kolor wypełnienia (symulowany) — Kolor wypełnienia.
- Przezroczystość wypełnienia (0-255, max 255) — Poziom przezroczystości wypełnienia.
- Gęstość wypełnienia (3-40, max 40) — Liczba linii używanych do symulacji wypełnienia (większa gęstość = bardziej solidne wypełnienie).
Pomysły na handel
- Wybicie i retest: czekaj, aż cena przebije Maksimum lub Minimum ramki, a następnie wróci, aby przetestować ten poziom jako wsparcie/opór przed wejściem w kierunku wybicia.
- Odwrócenie na ekstremach: jeśli cena dotknie Maksimum lub Minimum ramki bez silnego przebicia, może to sygnalizować odrzucenie i ruch w przeciwną stronę ramki.
- Kierunkowe nastawienie według sesji: kolor ramki daje szybkie nastawienie (wzrostowe/spadkowe/neutralne) dotyczące ruchu tej sesji, co jest przydatne do dostosowania wejść w późniejszych sesjach.
- Mid Price jako magnes: punkt środkowy często działa jako strefa równoważenia — szukaj wejść, gdy cena wraca do Mid po silnym impulsie.
- Porównaj kolejne ramki: ponieważ każda dzienna ramka jest zapisywana (za pomocą tagu daty), możesz porównać zakres i nastawienie kilku kolejnych sesji, aby dostrzec krótkoterminowe trendy.
Podsumowanie
Podsumowanie AI
LTtradingBox is a customizable trading indicator that visually highlights the price range—high, low, open, and close—within any user-defined time window, such as a specific trading session. The indicator draws a colored box representing this range, automatically changing its border color to green for bullish closes, red for bearish closes, or gray for neutral, with customizable color options. It includes reference lines for the midpoint price and midpoint time, which can be displayed as dotted or vertical lines, aiding in identifying liquidity zones, accumulation areas, and key support/resistance levels.
Users can configure start and end times, apply a UTC offset to align with local or session times, and toggle display options such as labels for price points, open/close lines, full box borders, and visual fills with adjustable color, opacity, and density. The indicator supports trading strategies including breakout and retest of box boundaries, reversal signals at extremes, session-based directional bias, and using the midpoint as a rebalancing zone. It also allows comparison of consecutive session boxes to detect short-term trends. LTtradingBox is designed to assist traders in quickly identifying key levels and market structure within chosen timeframes.
Users can configure start and end times, apply a UTC offset to align with local or session times, and toggle display options such as labels for price points, open/close lines, full box borders, and visual fills with adjustable color, opacity, and density. The indicator supports trading strategies including breakout and retest of box boundaries, reversal signals at extremes, session-based directional bias, and using the midpoint as a rebalancing zone. It also allows comparison of consecutive session boxes to detect short-term trends. LTtradingBox is designed to assist traders in quickly identifying key levels and market structure within chosen timeframes.
Profil wskaźnika
Kategoria wskaźnika
Wsparcie i opór
Typ wyjścia
Wizualizacja
Wymagania dotyczące danych
Tylko słupki
Obsługiwane sygnały
Przełamanie
Odwrócenie trendu
Przebicie poziomu
Dotknięcie poziomu
Opinie klientów
0.0
Opinie: 0
Opinie klientów
Ten produkt nie ma jeszcze opinii. Wypróbowałeś(-aś) go już? Bądź pierwszy(-a) i powiedz o tym innym!
Dyskusja
Częste pytania
Key Levels
Support & Resistance
Produkty dostępne za pośrednictwem cTrader Store, w tym boty handlowe, wskaźniki i wtyczki, dostarczane są przez deweloperów zewnętrznych i udostępniane wyłącznie w celach informacyjnych oraz w celu zapewnienia dostępu technicznego. cTrader Store nie jest brokerem i nie zapewnia doradztwa inwestycyjnego, nie udziela spersonalizowanych rekomendacji ani nie gwarantuje przyszłych wyników.
![Logo „[CB] Pivot Points Pro”](https://cdn.ctrader.com/image/webp/43463c82-67b0-4f10-a4ba-901bba091d81_32594)








![Logo „High-Low Divergence [Iridio Capital]”](https://cdn.ctrader.com/image/webp/10a9e91b-243a-43f6-bbfe-7376bad5a214_61554)







Cena
Od 10/01/2025