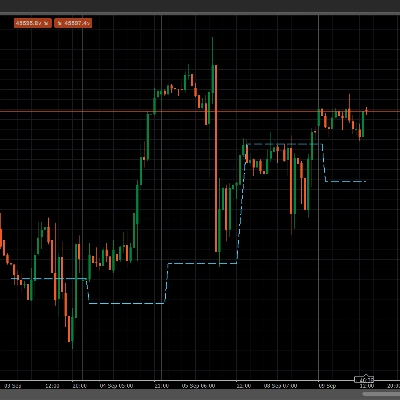
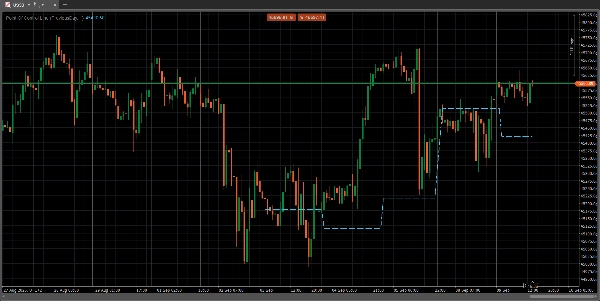
Logo de "POC Line lookback"
POC Line lookback
Image mise en ligne de "POC Line lookback"
Depuis le 21/04/2025

The Point of Control is a price level on a volume profile chart where the most trading volume has been conducted within a specified period. This level acts as a significant support or resistance zone because it represents a price where large trading institutions were most active and where market price found consensus. Traders use the line to identify key price zones, gauge market sentiment, and anticipate potential price movements and reversals

Indicator profile
0.0
Avis : 0
Avis clients
Il n'y a pas encore d'avis sur ce produit. Vous l'avez déjà essayé ? Soyez le premier à en parler aux autres !
Forex
Indices
Products available through cTrader Store, including trading bots, indicators and plugins, are provided by third-party developers and made available for informational and technical access purposes only. cTrader Store is not a broker and does not provide investment advice, personal recommendations or any guarantee of future performance.

Plus de cet auteur

Displays the POC line for previous sessions in an easy to see manner.

Vous pourriez aussi aimer

moving average cloud. you could change cloud color.
The "Daily Levels" indicator is used to display last week's and yestoday high/low price
trading stress-relief “mini-game”
Square Matrix Trading System by LudwigICT – Institutional-Grade Trading Clarity in cTrader
Show Renko Wicks / Tails. Solid Performance!
Day of Week Indicator for cTrader
Stop drawing levels manually. SmartLevels Pro detects, scores & predicts — H4/H1/M15 · cTrader
MultiFrameCandles para cTrader: La Herramienta Definitiva para Dominar Cualquier Marco de Tiempo
OHLC PRO – Advanced Session & Market Structure Tool
AI-powered KNN machine learning indicator for cTrader. Features dynamic ATR targets, trend filters & Telegram alerts.
This Indicator will display either the speed or the acceleration of the current symbol.
Add Slowing to IR Moving Average.
BR Master Trend indicator
SMC without the mess: Clean structure + auto-managing FVGs + MTF panel. Hard-right-edge, step size-based for any symbol.
Multi-timeframe candlesticks!
Price action to detect when the market changes trend (MSB) and defines, order blocks , ZigZag etc.📊
Institutional Flow Radar scans the chart for abnormal volume events and classifies them into two groups: Capital &Public
Logo de "Renko Wicks"
4.7
(4)
Gratuit
Renko Wicks
Depuis le 21/04/2025