
ATR advanced
Chỉ báo
Phiên bản 1.0, Apr 2026
Windows, Mac
4.3
Đánh giá: 3

32
Lượt bán
992
Cài đặt miễn phí
Mô tả
Hệ Thống ATR Nâng Cao về Biến Động & Xu Hướng
Chỉ số Average True Range (ATR) tiêu chuẩn là một công cụ tuyệt vời để đo lường biến động thị trường, nhưng ở dạng mặc định, nó chỉ là một đường đơn, khó đọc. Nó cho bạn biết biến động cao hay thấp, nhưng không chỉ bạn cách giao dịch với nó.
Chỉ số ATR Nâng Cao biến đổi chỉ số cơ bản này thành một hệ thống giao dịch trực quan hoàn chỉnh. Bằng cách giới thiệu Đường Tín Hiệu Biến Động, Thanh Màu Hướng Dẫn, và Biểu Đồ Động Lực, nó không chỉ cho bạn biết khi nào thị trường đang di chuyển, mà còn chính xác lượng năng lượng đằng sau xu hướng hiện tại.
Các Tính Năng Chính của PHIÊN BẢN ĐẦY ĐỦ:
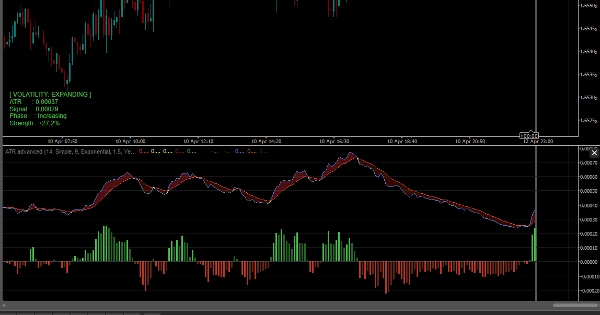
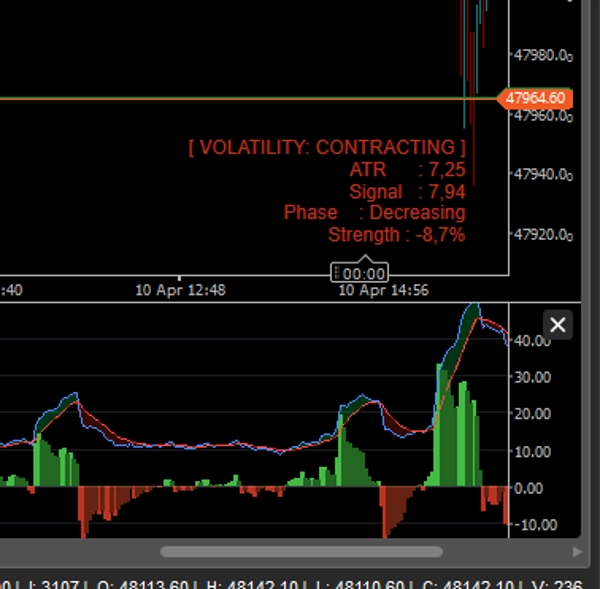
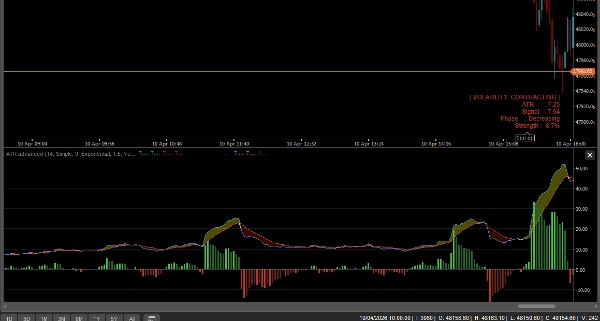
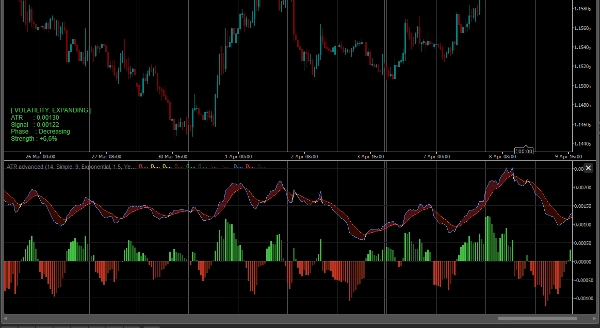
- Đám Mây Mở Rộng Biến Động: Chúng tôi đã thêm một Đường Trung Bình Động (Đường Tín Hiệu) vào ATR. Khoảng cách giữa ATR và Đường Tín Hiệu được lấp đầy bằng một Đám Mây động.
-
- Đám Mây Xanh Lá (Mở Rộng): Biến động đang tăng lên. Thị trường đang thức tỉnh và các xu hướng mạnh mẽ.
- Đám Mây Đỏ (Thu Hẹp): Biến động đang giảm. Thị trường đang tích lũy hoặc đi ngang.
- Biểu Đồ Động Lực: Một biểu đồ tùy chỉnh ở dưới cùng theo dõi chính xác sự khác biệt giữa ATR và Đường Tín Hiệu, giúp bạn phát hiện các đột phá biến động trước khi chúng hoàn toàn xảy ra.
- Tô Màu Thanh Thông Minh (Hướng + Biến Động): Đây là tính năng tối ưu. Chỉ báo đọc cả hướng giá (Tăng/Giảm) VÀ trạng thái biến động, tô màu nến của bạn tương ứng:
-
- Xanh Lá Sáng/Đỏ Sáng: Xu hướng mạnh + Biến động mở rộng (Hoàn hảo cho giao dịch đột phá và theo xu hướng).
- Xanh Lá Đậm/Đỏ Đậm: Xu hướng yếu + Biến động thu hẹp (Cảnh báo: Động lực đang giảm dần).
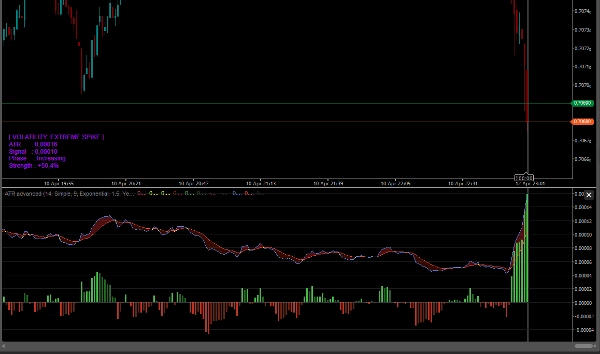
- Phát Hiện Biến Động Cực Đoan: Khi ATR tăng vọt bất thường (ví dụ, trong các sự kiện tin tức lớn hoặc đỉnh giá đột ngột), các nến chuyển sang màu Tím (Cực Đoan), cảnh báo bạn về khả năng kết thúc hoặc đột phá lớn.
- Bảng Thông Tin Thời Gian Thực: Một bảng điều khiển trên biểu đồ hiển thị chính xác giá trị ATR, Giai Đoạn Biến Động (Mở Rộng/Thu Hẹp), và chỉ số sức mạnh theo phần trăm.
- Mở Khóa Hoàn Toàn: Giao dịch trên BẤT KỲ biểu tượng nào (Forex, Crypto, Chỉ số, Cổ phiếu) và BẤT KỲ khung thời gian nào mà không giới hạn. Truy cập trọn đời.
Cách giao dịch với nó?
- Đột Phá: Tránh giao dịch khi Đám Mây Biến Động có màu Đỏ (Thu Hẹp). Chờ ATR cắt lên trên Đường Tín Hiệu (Đám Mây chuyển sang Xanh) và nến của bạn được tô màu Xanh Lá Sáng hoặc Đỏ Sáng. Điều này xác nhận một đột phá thực sự, có xác suất cao.
- Dừng Lỗ Theo Sau: Giữ các giao dịch thắng của bạn miễn là Đám Mây Biến Động vẫn màu Xanh. Khi nó cắt xuống và chuyển sang Đỏ, nghĩa là động lực đã cạn kiệt — thời điểm tuyệt vời để chốt lời.
- Cảnh Báo Đỉnh Điểm: Nếu bạn đang trong một xu hướng và các nến đột nhiên chuyển sang màu Tím, hãy cẩn thận! Điều này biểu thị một đột biến biến động cực đoan, thường xảy ra vào cuối xu hướng ngay trước khi có sự đảo chiều mạnh.
Tóm tắt
Tóm tắt AI
ATR Advanced is a volatility and trend indicator that enhances the standard Average True Range (ATR) by providing a comprehensive visual trading system. It integrates a Volatility Signal Line (a moving average of ATR) and fills the area between ATR and this line with dynamic Volatility Expansion Clouds. Green clouds indicate expanding volatility and strong trends, while red clouds signal contracting volatility and market consolidation.
Key features include a Momentum Histogram that tracks the difference between ATR and its Signal Line to identify volatility breakouts early, and smart bar coloring that reflects both price direction and volatility state. Bright green/red bars denote strong trends with expanding volatility, dark green/red bars indicate weak trends with contracting volatility, and purple bars warn of extreme volatility spikes often associated with trend climaxes or major events.
The indicator also includes a real-time on-chart dashboard displaying ATR values, volatility phases, and strength percentages. It supports all symbols—including Forex, cryptocurrencies, indices, and stocks—and any timeframe without limitations.
Traders can use it to confirm breakouts when volatility clouds turn green and bars brighten, manage trailing stops by monitoring volatility contraction, and receive warnings of potential trend reversals during extreme volatility spikes.
Key features include a Momentum Histogram that tracks the difference between ATR and its Signal Line to identify volatility breakouts early, and smart bar coloring that reflects both price direction and volatility state. Bright green/red bars denote strong trends with expanding volatility, dark green/red bars indicate weak trends with contracting volatility, and purple bars warn of extreme volatility spikes often associated with trend climaxes or major events.
The indicator also includes a real-time on-chart dashboard displaying ATR values, volatility phases, and strength percentages. It supports all symbols—including Forex, cryptocurrencies, indices, and stocks—and any timeframe without limitations.
Traders can use it to confirm breakouts when volatility clouds turn green and bars brighten, manage trailing stops by monitoring volatility contraction, and receive warnings of potential trend reversals during extreme volatility spikes.
Hồ sơ chỉ báo
Danh mục chỉ báo
Động lượng
Loại đầu ra
Hình ảnh trực quan
Tín hiệu
Bộ lọc
Yêu cầu dữ liệu
Chỉ dữ liệu nến
Tín hiệu được hỗ trợ
Sức mạnh xu hướng
Biến động
Thảo luận
Đánh giá của khách hàng
4.3
Đánh giá: 3
5 | 33 % | |
4 | 67 % | |
3 | 0 % | |
2 | 0 % | |
1 | 0 % |
Đánh giá của khách hàng
April 24, 2026
20 signals gives enough for a first read, and the signal gets compared with context.
April 18, 2026
3 percent DD is the line to watch, and the log becomes easier to read.
Câu hỏi thường gặp
ATR
Moving Average
Các sản phẩm có sẵn trên cTrader Store, bao gồm bot giao dịch, chỉ báo và plugin, được cung cấp bởi các nhà phát triển bên thứ ba và chỉ nhằm mục đích cung cấp thông tin và tiếp cận kỹ thuật. cTrader Store không phải là nhà môi giới và không cung cấp lời khuyên đầu tư, khuyến nghị cá nhân hay bất kỳ đảm bảo nào về hiệu suất trong tương lai.






























Giá
32
Lượt bán
992
Cài đặt miễn phí