Mô tả
Bộ Dao động Trendlines giúp các nhà giao dịch xác định xu hướng và động lượng dựa trên khoảng cách chuẩn hóa giữa giá hiện tại và các đường xu hướng tăng và giảm được phát hiện gần đây nhất.
Chỉ báo này có các động lượng tăng và giảm, một đường tín hiệu với các điểm cắt, và nhiều tùy chọn làm mượt.
CÁCH SỬ DỤNG
Bộ Dao động Trendlines hoạt động bằng cách hệ thống:
- Xác định các điểm pivot cao và thấp.
- Nối các điểm pivot để tạo thành các đường xu hướng tăng (hỗ trợ) và giảm (kháng cự).
- Đo khoảng cách (delta) giữa giá hiện tại và các đường xu hướng đó.
- Chuẩn hóa các khoảng cách này trong khoảng từ 0 đến 100 để tạo giá trị động lượng.
- Làm mượt các giá trị để tín hiệu rõ ràng hơn.
- Tạo tín hiệu tăng và giảm khi động lượng cắt qua đường tín hiệu.
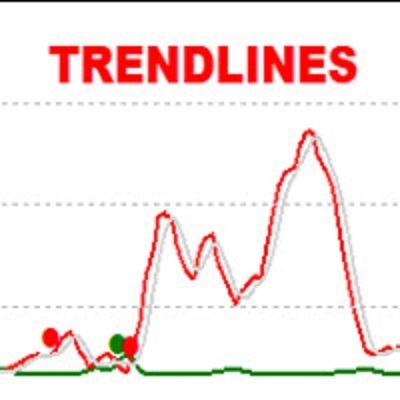
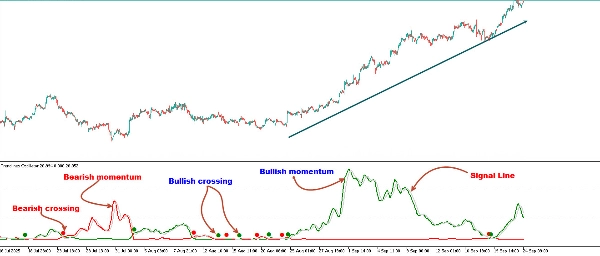
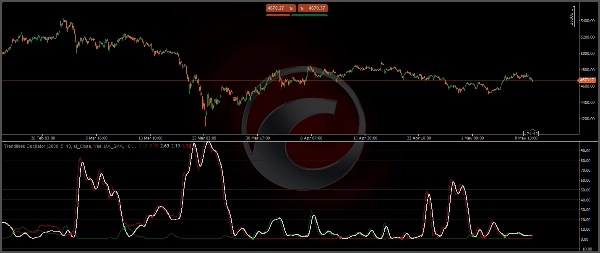
Bộ dao động hiển thị ba đường chính:
Đường Động lượng Tăng (Màu Xanh lá): Đo sức mạnh người mua bằng cách tính khoảng cách giá so với các đường xu hướng hỗ trợ tăng gần đây.
Đường Động lượng Giảm (Màu Đỏ): Đo sức mạnh người bán bằng cách tính khoảng cách giá so với các đường xu hướng kháng cự giảm gần đây.
Đường Tín hiệu (Màu Xám): Cung cấp các điểm cắt với các đường động lượng để làm nổi bật các cơ hội giao dịch tiềm năng.
Theo quy tắc chung, khi đường động lượng tăng nằm trên đường động lượng giảm, điều đó cho thấy sức mạnh người mua. Điều này có nghĩa là giá thực tế cách xa các đường xu hướng hỗ trợ hơn so với các đường xu hướng kháng cự. Ngược lại đúng với sức mạnh người bán.
Để tính động lượng tăng, công cụ đầu tiên xác định các đường xu hướng tăng đóng vai trò hỗ trợ bên dưới giá. Sau đó, nó đo delta giữa giá và các đường xu hướng đó và chuẩn hóa kết quả thành các giá trị động lượng hiển thị.
Quy trình tương tự được sử dụng cho động lượng giảm, nhưng với các đường xu hướng giảm đóng vai trò kháng cự bên trên giá.
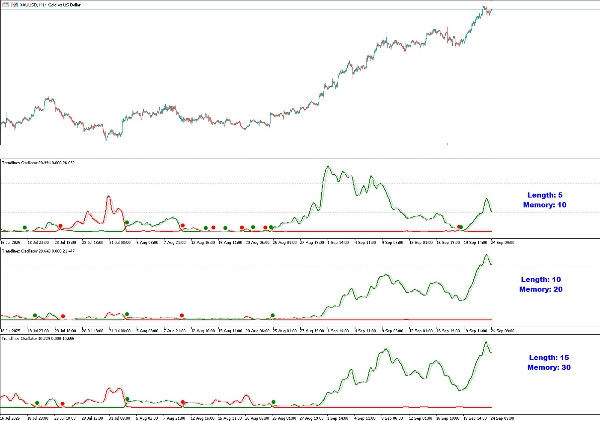
Độ dài & Bộ nhớ
- Độ dài: Xác định kích thước cấu trúc thị trường được sử dụng để phát hiện các đường xu hướng. Giá trị lớn hơn bắt được các xu hướng rộng hơn, trong khi giá trị nhỏ hơn làm công cụ nhạy hơn với các biến động ngắn hạn.
- Bộ nhớ: Kiểm soát số lượng đường xu hướng được xem xét trong các phép tính. Giá trị bộ nhớ cao làm mượt tín hiệu cho phân tích dài hạn, trong khi giá trị bộ nhớ nhỏ hơn cho phản ứng nhanh hơn.
Việc thay đổi các giá trị Độ dài và Bộ nhớ sẽ khiến công cụ hiển thị các giá trị động lượng khác nhau.
Các nhà giao dịch có thể điều chỉnh độ dài để phát hiện các đường xu hướng lớn hơn và điều chỉnh bộ nhớ để chỉ định số lượng đường xu hướng mà công cụ nên xem xét.
Như biểu đồ trên cho thấy, giá trị nhỏ hơn làm công cụ phản ứng nhanh hơn, trong khi giá trị lớn hơn hữu ích để phát hiện các xu hướng lớn hơn.
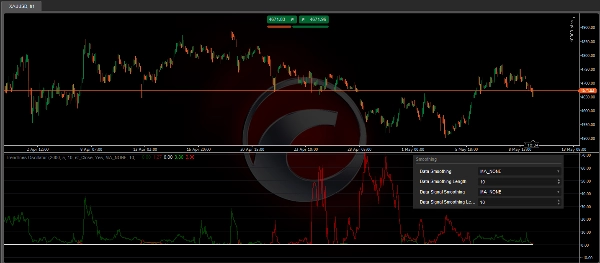
Làm mượt
- Làm mượt dữ liệu: Áp dụng làm mượt cho các giá trị động lượng thô.
- Làm mượt tín hiệu: Làm mượt chính đường tín hiệu để các điểm cắt rõ ràng hơn.
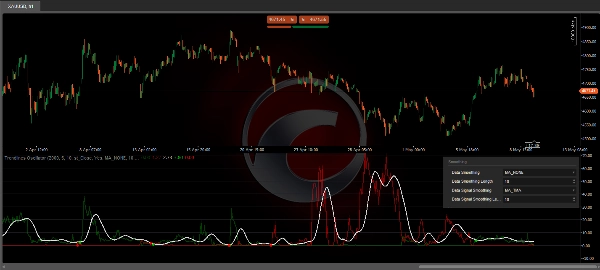
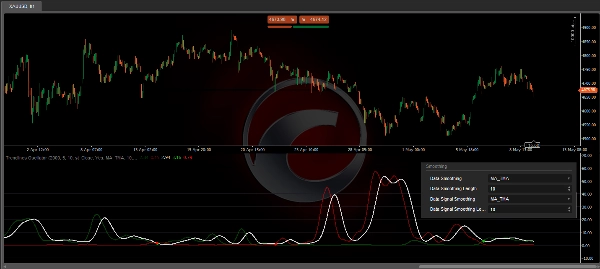
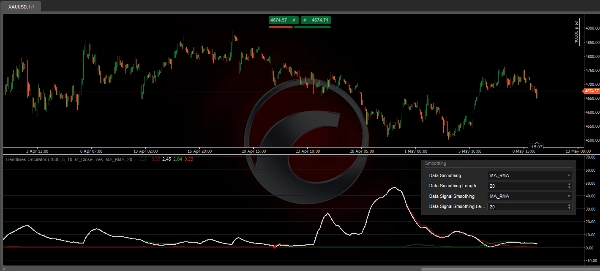
Theo mặc định, dữ liệu được làm mượt bằng SMA, và tín hiệu sử dụng trung bình động tam giác với độ dài 10. Các nhà giao dịch có thể làm mượt cả dữ liệu và đường tín hiệu.
Các nhà giao dịch có thể chọn các phương pháp khác nhau, hoặc không sử dụng phương pháp nào. Một số ví dụ được hiển thị trên các hình ảnh đính kèm.
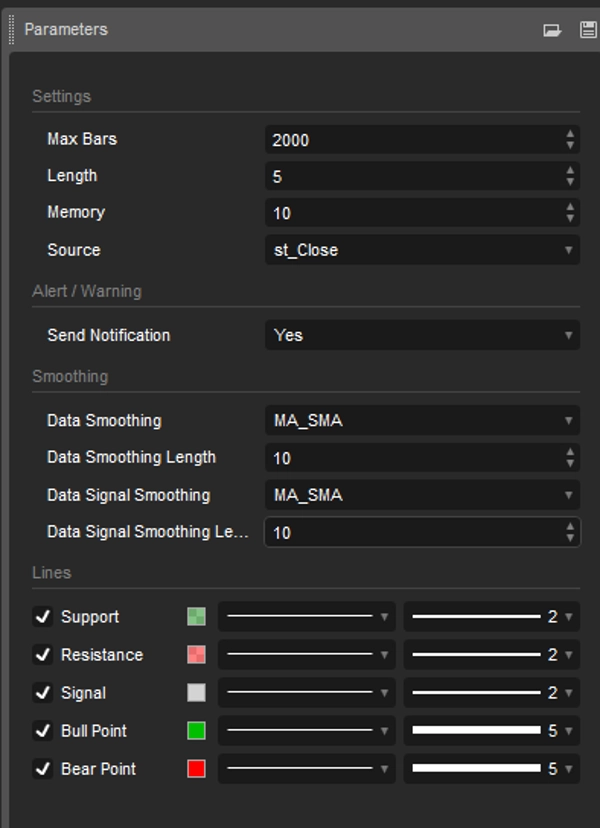
CÀI ĐẶT
- Độ dài: Kích thước cấu trúc thị trường được sử dụng để phát hiện đường xu hướng.
- Bộ nhớ: Số lượng đường xu hướng được sử dụng trong các phép tính.
- Nguồn: Nguồn cho các phép tính mặc định là giá đóng cửa.
- Làm mượt dữ liệu: Chọn phương pháp và độ dài làm mượt
- Làm mượt tín hiệu: Chọn phương pháp và độ dài làm mượt
- Cảnh báo: Cảnh báo/Thông báo khi có điểm cắt tăng/giảm
- Kiểu dáng: Điều chỉnh màu sắc, kiểu, độ rộng của các đường Hỗ trợ/Kháng cự/Tín hiệu
Chỉ báo giao dịch Trendlines Oscillator lý tưởng cho các nhà giao dịch muốn:
- Một cái nhìn về động lượng dựa trên đường xu hướng thay vì chỉ dựa vào các trung bình động hoặc RSI.
- Các điểm cắt trực quan rõ ràng để báo hiệu các điểm vào và ra tiềm năng.
- Làm mượt tùy chỉnh để thích ứng với các phong cách giao dịch khác nhau.
- Một công cụ làm nổi bật sự thống trị của người mua so với người bán trong thời gian thực.
- Bằng cách kết hợp phân tích cấu trúc thị trường với các phép tính động lượng, công cụ này cung cấp lợi thế độc đáo trong việc phát hiện cả cơ hội tiếp tục xu hướng và đảo chiều.
Tóm tắt
Users can customize the indicator’s sensitivity and responsiveness by adjusting the Length (market structure size for trendline detection) and Memory (number of trendlines considered). The tool also offers data and signal smoothing options using various methods, including SMA and triangular moving averages, to provide clearer signals. The Trendlines Oscillator supports alerts for bullish and bearish crossovers and allows customization of line styles and colors. It provides a structural market analysis combined with momentum calculations to help traders assess buyer versus seller dominance and identify trend continuation or reversal opportunities.


