present
سجل واحصل على خصم 50 دولارًا على مشترياتك الأولى
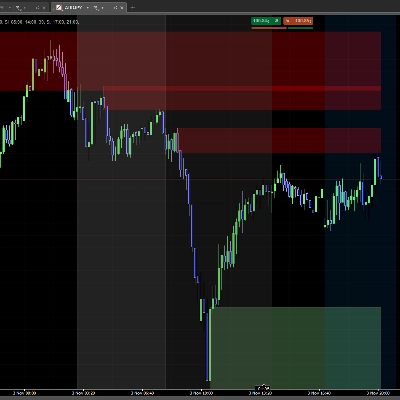
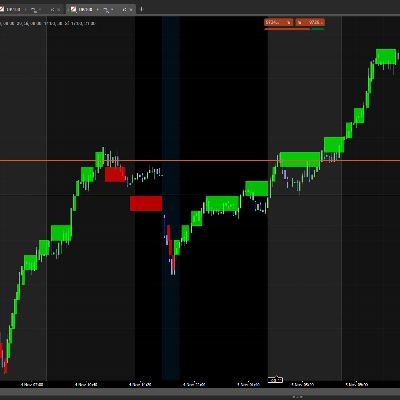
Trading product for FSP_CumulativeDelta مؤشر Volume, image 1
FSP_CumulativeDelta
مؤشر
الإصدار 1.0، May 2026
Windows, Mac
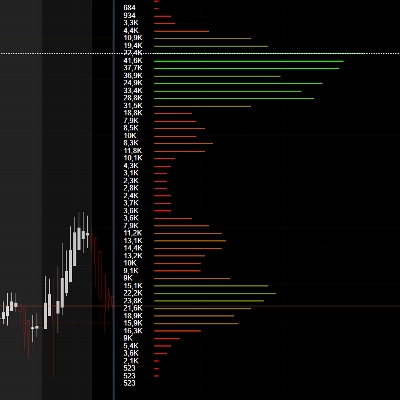
Trading product for FSP_CumulativeDelta مؤشر Volume, image 2
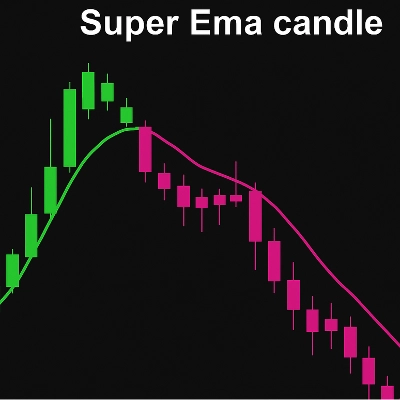
Trading product for FSP_CumulativeDelta مؤشر Volume, image 3
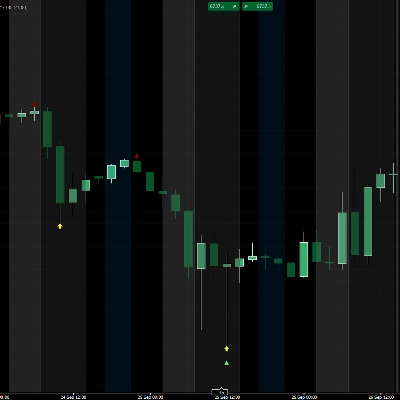
Trading product for FSP_CumulativeDelta مؤشر Volume, image 4
Trading product for FSP_CumulativeDelta مؤشر Volume, image 5
منذ 24/02/2025
18
المبيعات
2.21K
التثبيتات المجانية

الوصف

FSP CumulativeDelta — مؤشر ضغط السوق

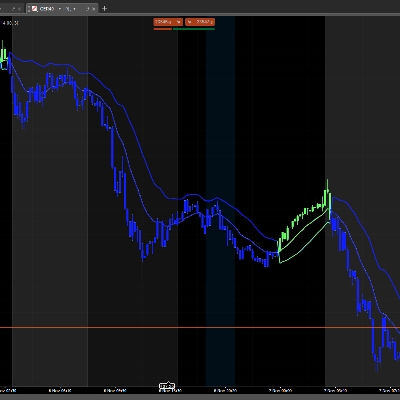
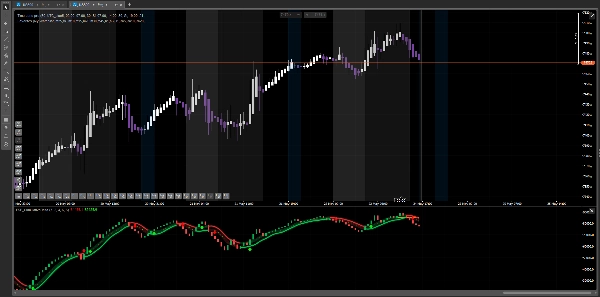
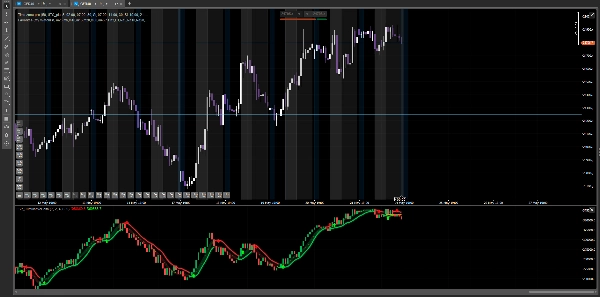
FSP CumulativeDelta هو مؤشر متقدم يجمع بين أداتين قويتين في نافذة واحدة: تحليل ضغط الشراء والبيع شريطًا بشريط، مع نظام كشف الاتجاه الذي يساعدك على تحديد اللحظة الدقيقة التي يغير فيها السوق اتجاهه.

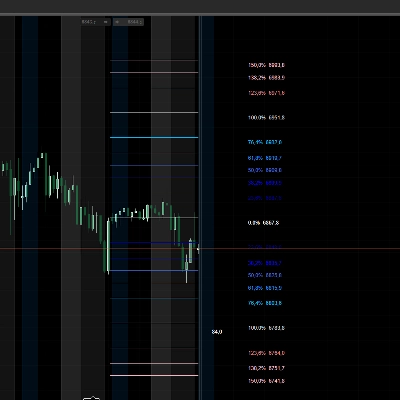
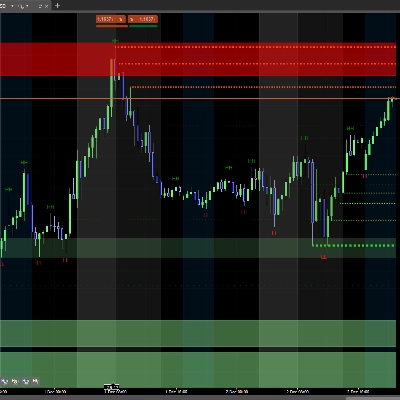
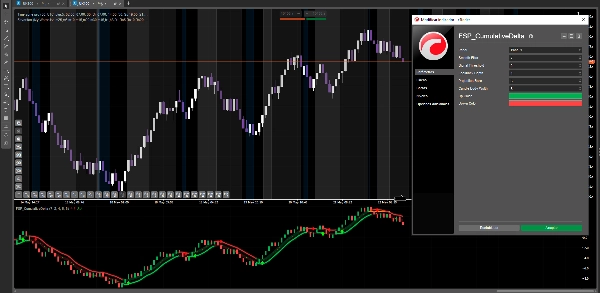
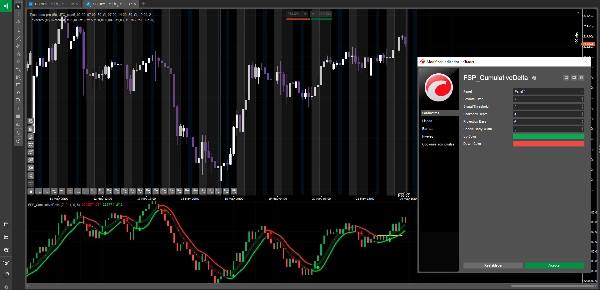
ماذا يفعل؟ يعرض المؤشر شموع ضغط السوق في مخطط فرعي منفصل — ليس السعر، بل القوة الحقيقية وراء كل حركة. فوق تلك الشموع يرسم سحابة ديناميكية تتغير ألوانها وفقًا للاتجاه: أخضر عندما يهيمن ضغط الشراء، وأحمر عندما يسيطر ضغط البيع. كما يرسم خطوط مستويات رئيسية ويولد إشارات بصرية في اللحظة التي يكسر فيها السوق تلك المستويات، مشيرًا إلى فرصة دخول محتملة.

كيفية استخدامه؟ أضف المؤشر إلى أي مخطط وإطار زمني. راقب لون السحابة لفهم اتجاه الضغط الحالي. عندما يظهر سهم أخضر متجه للأعلى، يكون ضغط الشراء قد كسر مستوى رئيسيًا — فرصة صعودية محتملة. عندما يظهر سهم أحمر متجه للأسفل، يكون ضغط البيع قد كسر مستوى رئيسيًا — فرصة هبوطية محتملة. يمكنك تشغيل أو إيقاف إشارة الاتجاه من الإعدادات لعرض شموع الضغط فقط. ألوان الشموع قابلة للتخصيص بالكامل من لوحة التكوين.

الأسواق المتوافقة: الفوركس، المؤشرات، السلع، العملات المشفرة.

تنبيه المخاطر: تحمل الأسواق المالية مخاطر متأصلة لفقدان رأس المال. هذا المؤشر هو أداة تحليل ولا يضمن أي نتائج. تداول دائمًا برأس مال يمكنك تحمل خسارته وأدر مخاطر تداولك بحكمة في كل صفقة.

الملخص

ملخص الذكاء الاصطناعي
FSP CumulativeDelta is a market pressure indicator designed for use on various financial charts and timeframes. It combines bar-by-bar buying and selling pressure analysis with a trend detection system in a single sub-chart. Instead of displaying price, it visualizes the underlying market force through pressure candles and overlays a dynamic cloud that changes color—green for dominant buying pressure and red for dominant selling pressure. The indicator also plots key level lines and provides visual signals when these levels are broken, indicating potential bullish or bearish opportunities. Users can customize candle colors and toggle trend signals on or off. FSP CumulativeDelta supports multiple markets including Forex, indices, commodities, and cryptocurrencies. It requires tick data for operation and outputs visual trend strength signals to assist in market direction analysis.
ملف تعريف المؤشر
فئة المؤشر
الحجم
نوع المخرجات
التصور
متطلبات البيانات
بيانات التيك
الإشارات المدعومة
قوة الاتجاه

مناقشة

تقييمات العملاء

0.0
التقييمات: 0
تقييمات العملاء
لا توجد تقييمات لهذا المنتج حتى الآن. هل جرَّبته بالفعل؟ كن أول من يخبر الآخرين!

الأسئلة الشائعة

Volume
يتم توفير المنتجات المتاحة من خلال cTrader Store، بما في ذلك روبوتات التداول والمؤشرات والإضافات، من قبل مطوري الطرف الثالث وإتاحتها لأغراض الوصول المعلوماتي والفني فقط. cTrader Store ليس وسيطًا ولا يقدم نصائح استثمارية أو توصيات شخصية أو أي ضمان للأداء المستقبلي.

المزيد من هذا المؤلف

مؤشر
Forex
Crypto
+1
Order block
مؤشر
Forex
NAS100
+3
volumen perfile
مؤشر
Forex
Crypto
+3
FREE Global Trading Sessions Indicator
مؤشر
Forex
Crypto
+2
PREMIUN INDICATOR
مؤشر
Forex
Crypto
+1
Super Arrows
مؤشر
Forex
Crypto
+3
Perfect Trend
مؤشر
Forex
Crypto
+2
Daily Fibo
مؤشر
Forex
Crypto
+5
ICT Order Block Advanced
مؤشر
Signal
Bollinger
BB20 MULTICOLOR
مؤشر
Forex
Crypto
+2
HTF Candle
إضافة سطح المكتب
Trade Alerts
Quick Switch Toolbar
مؤشر
Supertrend
Moving Average
Easy Trade: Trend & Breakout Indicator for cTrader

قد يعجبك أيضًا

مؤشر
Prop
Forex
+11
🌊 See when the market is truly in play. Tsunami measures Relative Volume by time-of-day 🌊
مؤشر
ATR
Wedge
+2
Strong Supertrend Turn Market Movement into a Clear Map Market analysis
مؤشر
Forex
Version 3: Full control of session display including start and end times of all 3 sessions!
مؤشر
Indices
Breakout
+1
You can use the cTrader Pivot Points Pro indicator to find a good pullback entry in a trend
مؤشر
RSI
MACD
+1
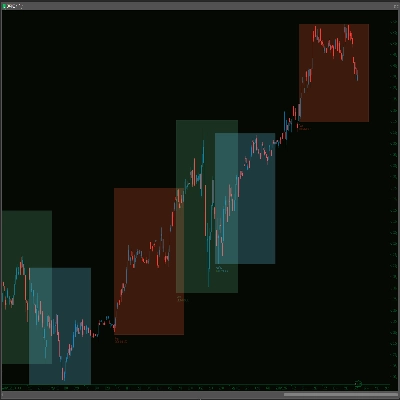
Precision Supply & Demand zones indicator—automatically plots key buy/sell areas on your chart for smarter entries.
شعار "VA Footprint"
الأعلى تقييمًا
4.5
(4)
من 19$
مؤشر
SMC
Prop
+5
VA Footprint replaces your chart with a order flow one, the most precise way to read the market.
مؤشر
Doji
Volume
+5
Instantly spot high-liquidity institutional moves with clean, non-obtrusive triangle alerts on cTrader charts.
مؤشر
ATR
BOS
+5
Opening ranges, dynamic trend channels, and multi-scale breakout/retest analysis for clear intraday chart decisions.
مؤشر
Prop
Forex
+11
⚡Nebula Range Filter is a professional trend filter indicator for cTrader⚡
مؤشر
ATR
Scalping
+1
Auto Fibonacci Retracement Pro – Smart Swing & Golden Zone Levels
مؤشر
Prop
Forex
+12
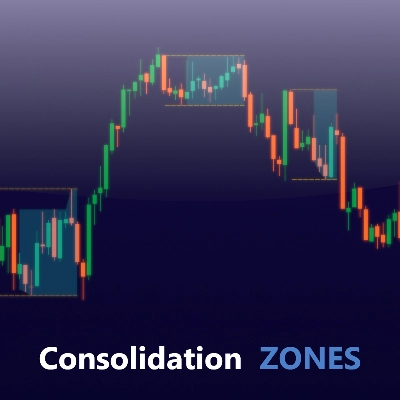
Identify and trade breakouts with Consolidation Zones! Visualize price consolidation areas for trading opportunities.
مؤشر
ADX
ATR
+5
SuperTrend signals scored on five confluence factors, with an ATR stop, three targets and a dashboard.
مؤشر
ATR
EMA
+3
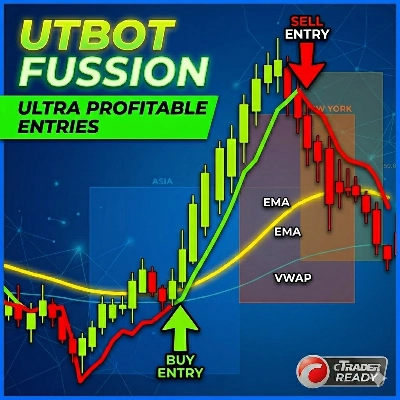
The UTBot you know from TradingView — now on cTrader with confirmed signals, VWAP, EMA and session overlays.
مؤشر
AI
ATR
+27
Supertrend Indicator
مؤشر
Doji
Wedge
+5
Angora Pattern Recognition is a cTrader indicator that finds, draws and tracks classic chart patterns automatically.
شعار "Dynamic Trend Gradient"
الأعلى تقييمًا
4.2
(5)
$19
/
$22
مؤشر
RSI
Signal
+2
Identifies trends with moving averages & volatility. Base levels = bullish 🐂 or bearish 🐻 signals. Reversals detected!
شعار "Regime Filter Pro (+ Alerts)"
الأعلى تقييمًا
4.6
(5)
$19
مؤشر
AI
SMC
+9
Identifies market trends (-10 to +10) using HMA with volume confirmation. Includes customizable alerts.
مؤشر
Volume
Order Block
+3
Map market structure, order blocks, liquidity and key zones with an interactive cTrader dashboard.

السعر

منذ 24/02/2025
18
المبيعات
2.21K
التثبيتات المجانية