
Chỉ Báo Vùng Donchian Nâng Cao cho cTrader
Làm Chủ Xu Hướng Thị Trường & Đột Phá Với Độ Chính Xác!
Nâng tầm giao dịch của bạn với Chỉ Báo Vùng Donchian Nâng Cao – một công cụ mạnh mẽ được thiết kế cho các nhà giao dịch yêu cầu độ chính xác, linh hoạt và hiệu quả. Chỉ báo thế hệ tiếp theo này cải tiến Kênh Donchian cổ điển bằng cách giới thiệu phân tích đa khung thời gian, tính toán giá tùy chỉnh, cảnh báo thời gian thực, và trực quan hóa đám mây.
Dù bạn giao dịch ngoại hối, cổ phiếu hay hàng hóa, Chỉ Báo Vùng Donchian Nâng Cao trang bị cho bạn công cụ để nhận diện đột phá, theo xu hướng và giao dịch đảo chiều như một chuyên gia.
Tính Năng & Lợi Ích Chính:
1. Vùng Donchian Đa Khung Thời Gian
- Phân tích Vùng Donchian từ khung thời gian cao hơn trong khi giao dịch trên khung thấp hơn, đảm bảo bạn luôn đồng bộ với xu hướng thị trường lớn hơn.
- Lý tưởng cho nhà giao dịch trong ngày và giao dịch lướt sóng muốn tối ưu hóa điểm vào và ra.
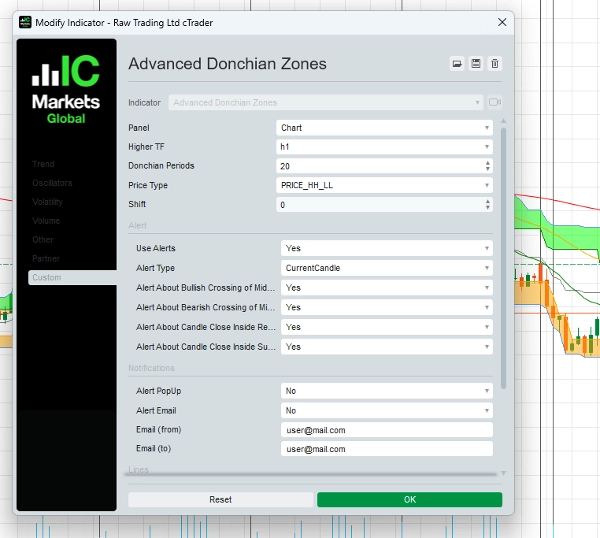
2. Tính Toán Giá Tùy Chỉnh
- Chọn từ năm loại giá nâng cao để tinh chỉnh chiến lược của bạn:
-
- Giá Cao Nhất / Giá Thấp Nhất
- Trung Bình của Giá Cao/Mở hoặc Giá Cao/Đóng
- Giá Mở Cao Nhất / Giá Mở Thấp Nhất
- Giá Đóng Cao Nhất / Giá Đóng Thấp Nhất
- Điều chỉnh chỉ báo phù hợp với phong cách giao dịch và quản lý rủi ro của bạn.
3. Cảnh Báo Động – Không Bao Giờ Bỏ Lỡ Cơ Hội!
- Nhận thông báo thời gian thực khi các sự kiện giao dịch quan trọng xảy ra:
-
- Giao Cắt Đường Giữa (tín hiệu tăng hoặc giảm)
- Giá Đóng Bên Trong Các Vùng Quan Trọng (vùng đảo chiều hoặc đột phá tiềm năng)
- Cảnh báo có sẵn qua cửa sổ bật lên và email, giúp bạn luôn dẫn đầu biến động thị trường.
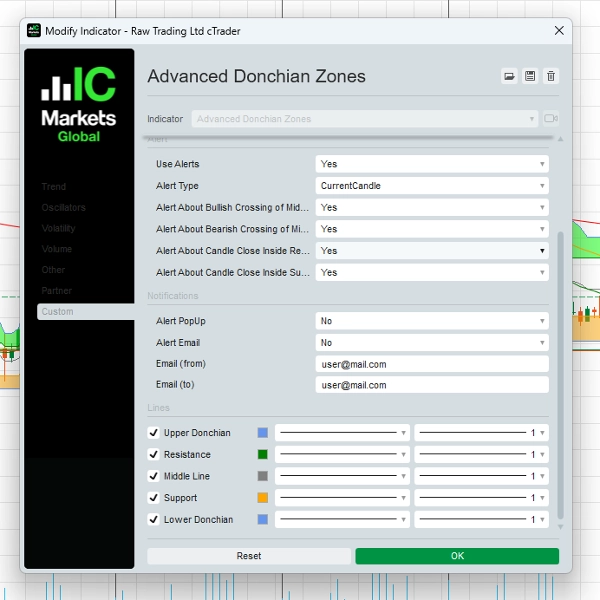
4. Trực Quan Hóa Đám Mây Cho Cái Nhìn Rõ Ràng
- Các vùng tô bóng độc đáo giữa các mức Donchian giúp nhà giao dịch dễ dàng nhận diện vùng hỗ trợ, kháng cự và đột phá một cách nhanh chóng và hiệu quả.
5. Tham Số Dịch Linh Hoạt
- Điều chỉnh vị trí Vùng Donchian tiến hoặc lùi theo thời gian để tinh chỉnh chiến lược giao dịch của bạn.
6. Giao Diện Dễ Sử Dụng
- Thiết kế dành cho nhà giao dịch ở mọi cấp độ, với bố cục trực quan và cài đặt tùy chỉnh phù hợp với sở thích giao dịch của bạn.
Cách Sử Dụng Chỉ Báo Vùng Donchian Nâng Cao
1. Chiến Lược Giao Dịch Đột Phá – Nắm Bắt Những Diễn Biến Bùng Nổ!
- Thiết Lập:
-
- Áp dụng Chỉ Báo Vùng Donchian Nâng Cao lên biểu đồ của bạn.
- Chọn kỳ Donchian (ví dụ: 20) và một khung thời gian cao hơn (ví dụ: 1H hoặc 4H) để có tín hiệu chính xác hơn.
- Vào Lệnh:
-
- Mua vào khi giá phá vỡ và đóng cửa trên vùng Donchian trên cùng.
- Bán ra khi giá phá vỡ và đóng cửa dưới vùng Donchian dưới cùng.
- Thoát Lệnh:
-
- Sử dụng đường giữa hoặc vùng Donchian đối diện làm mức thoát lệnh.
- Ví Dụ:
-
- Nếu giao dịch trên biểu đồ 15 phút, đặt phép tính Donchian dựa trên khung thời gian 1 giờ. Khi giá phá vỡ trên mức Donchian trên cùng, vào lệnh mua với điểm dừng lỗ gần đường giữa.
2. Chiến Lược Theo Xu Hướng – Theo Dõi Đà Thị Trường
- Thiết Lập:
-
- Sử dụng đường giữa làm bộ lọc xu hướng.
- Chỉ giao dịch theo hướng của xu hướng hiện tại.
- Vào Lệnh:
-
- Mua vào khi giá ở trên đường giữa và bật lên từ vùng hỗ trợ.
- Bán ra khi giá ở dưới đường giữa và bật lên từ vùng kháng cự.
- Thoát Lệnh:
-
- Đóng lệnh khi giá cắt đường giữa theo hướng ngược lại.
- Ví Dụ:
-
- Trên biểu đồ 4 giờ, giá duy trì ở trên đường giữa, xác nhận xu hướng tăng. Vào lệnh mua khi giá hồi về vùng hỗ trợ và có dấu hiệu đảo chiều.
3. Chiến Lược Giao Dịch Trong Biên Độ – Kiếm Lợi Nhuận Trong Thị Trường Đi Ngang
- Thiết Lập:
-
- Xác định các khoảng thời gian giá dao động giữa vùng Donchian trên và dưới.
- Vào Lệnh:
-
- Mua vào khi giá tiếp cận vùng hỗ trợ.
- Bán ra khi giá tiếp cận vùng kháng cự.
- Thoát Lệnh:
-
- Chốt lời gần vùng Donchian đối diện hoặc khi xảy ra đột phá.
- Ví Dụ:
-
- Trên biểu đồ 1 giờ, nếu giá dao động giữa các mức Donchian trên và dưới, thực hiện giao dịch tại các điểm cực này để tận dụng cơ hội đảo chiều trung bình.
Tại Sao Các Nhà Giao Dịch Chọn Vùng Donchian Nâng Cao
✔ Đa Dạng Cho Các Phong Cách Giao Dịch Khác Nhau – Phù hợp cho đột phá, theo xu hướng và giao dịch trong biên độ.
✔ Nâng Cao Độ Chính Xác Giao Dịch – Nhận diện chính xác các mức hỗ trợ & kháng cự quan trọng.
✔ Cảnh Báo Thời Gian Thực – Luôn được cập nhật với thông báo ngay lập tức.
✔ Công Cụ Chuyên Nghiệp – Phát triển dành cho các nhà giao dịch tìm kiếm lợi thế trên thị trường.
Giá & Ưu Đãi Độc Quyền
Giá Đặc Biệt Có Thời Hạn: $97 (Thanh Toán Một Lần)
Bao gồm:
- Chỉ Báo Vùng Donchian Nâng Cao cho cTrader
- Hướng Dẫn Sử Dụng Toàn Diện với các chiến lược từng bước
- Cập Nhật Miễn Phí trong 1 Năm
- Hỗ Trợ Email Ưu Tiên
Phản Hồi Từ Các Nhà Giao Dịch
“Tôi đã sử dụng Kênh Donchian nhiều năm, nhưng chỉ báo này nâng tầm lên một cấp độ khác. Tính năng đa khung thời gian thật sự thay đổi cuộc chơi!”
— Mark S., Nhà Giao Dịch Forex
“Các cảnh báo và cài đặt giá tùy chỉnh giúp tôi bắt được các giao dịch đột phá với sự tự tin hơn. Rất khuyến nghị cho các nhà giao dịch nghiêm túc.”
— Lisa T., Nhà Giao Dịch Lướt Sóng
Bắt Đầu Ngay Hôm Nay!
Sẵn sàng biến đổi giao dịch của bạn? Nhấn nút bên dưới để mua Chỉ Báo Vùng Donchian Nâng Cao và bắt đầu giao dịch với độ chính xác!
[Mua Ngay với $97]
Bảo Đảm Hoàn Tiền Trong 30 Ngày
Chúng tôi cam kết với sản phẩm của mình. Nếu bạn không hoàn toàn hài lòng, hãy liên hệ với chúng tôi trong vòng 30 ngày để được hoàn tiền đầy đủ – không cần hỏi lý do.
Cần Giúp Đỡ? Liên Hệ Với Chúng Tôi!
📧 Email: o.elmottaqy@gmail.com
🌐 Website: https://t.me/mottaqyo
Tuyên Bố Rủi Ro
Giao dịch có rủi ro. Chỉ Báo Vùng Donchian Nâng Cao là công cụ hỗ trợ quyết định giao dịch của bạn nhưng không đảm bảo lợi nhuận. Luôn sử dụng quản lý rủi ro hợp lý và giao dịch có trách nhiệm.
5 | 50 % | |
4 | 50 % | |
3 | 0 % | |
2 | 0 % | |
1 | 0 % |


![Logo "[Hamster-Coder] Bollinger Bands"](https://cdn.ctrader.com/image/webp/21d8e5d6-fb11-4bac-b9ee-cd05c2b76804_30327)
![Logo "[Stellar Strategies] Market Session Ultimate"](https://cdn.ctrader.com/image/webp/61ffd537-0125-4246-9e72-42eca1791d64_28232)

