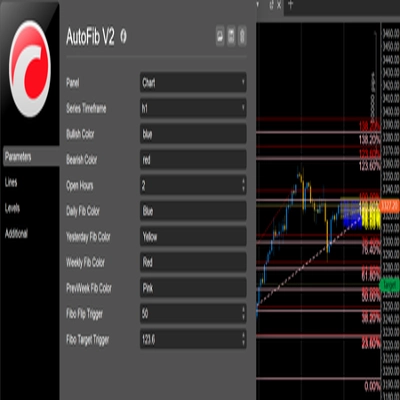
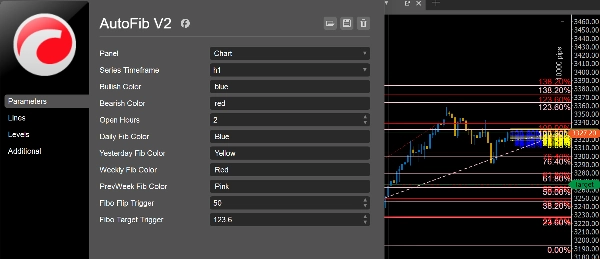
CursorbyteAutoFib v2
Chỉ báo
Phiên bản 1.0, Apr 2025
Windows, Mac
Mô tả
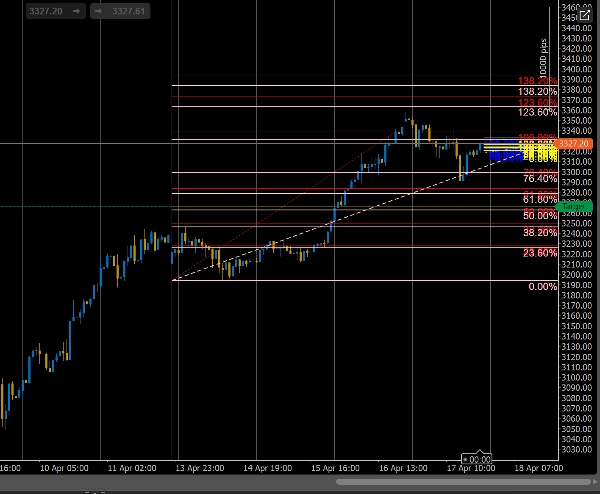
Chỉ báo cTrader này tự động vẽ các mức thoái lui và mở rộng Fibonacci dựa trên các biến động giá gần đây. Nó giúp các nhà giao dịch xác định các vùng hỗ trợ, kháng cự và mục tiêu tiềm năng, giúp dễ dàng lên kế hoạch vào lệnh, thoát lệnh và đặt điểm dừng lỗ một cách chính xác.
Tóm tắt
Hồ sơ chỉ báo
Đánh giá của khách hàng
0.0
Đánh giá: 0
Đánh giá của khách hàng
Sản phẩm này chưa có đánh giá nào. Bạn đã dùng thử chưa? Hãy là người đầu tiên chia sẻ với mọi người!
Thảo luận
Câu hỏi thường gặp
Các sản phẩm có sẵn trên cTrader Store, bao gồm bot giao dịch, chỉ báo và plugin, được cung cấp bởi các nhà phát triển bên thứ ba và chỉ nhằm mục đích cung cấp thông tin và tiếp cận kỹ thuật. cTrader Store không phải là nhà môi giới và không cung cấp lời khuyên đầu tư, khuyến nghị cá nhân hay bất kỳ đảm bảo nào về hiệu suất trong tương lai.


Giá
Kể từ 31/10/2024
56
Lượt bán
1.75K
Cài đặt miễn phí