Mô tả
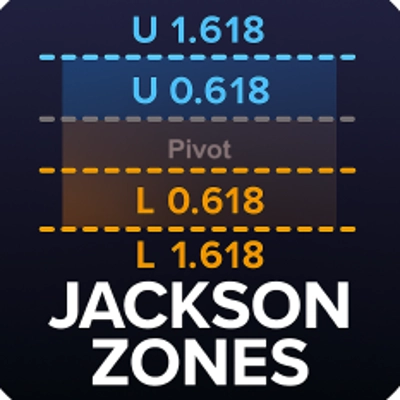
📊 Jackson Zones — Bản Đồ Vùng Fibonacci Thích Ứng
Tiết lộ nhịp điệu bên dưới hành động giá. Jackson Zones lập bản đồ cấu trúc trong ngày và nhiều ngày sử dụng phạm vi phiên dự đoán theo Fibonacci, nhãn thích ứng và logic thời gian mạnh mẽ. Được thiết kế cho độ rõ ràng cấp tổ chức, đây là lợi thế của bạn trong các thị trường biến động.
🔍 Tính Năng Chính
- Hệ Số Fibonacci Có Thể Tùy Chỉnh
Xác định tỷ lệ mở rộng của riêng bạn (mặc định: 0.618, 1.000, 1.618) để điều chỉnh các vùng phù hợp với chiến lược của bạn.
- Chế Độ Nhiều Ngày: Bật để mở rộng các vùng qua nhiều phiên, tiết lộ cấu trúc bền vững và sự hội tụ dài hạn.
- Logic Cuối Tuần
Tự động sử dụng dữ liệu ngày thứ Sáu cho cả phiên Chủ Nhật và Thứ Hai, đảm bảo các mức độ tin cậy ngay cả trên các nhà môi giới có thanh dữ liệu Chủ Nhật.
- Độ Linh Hoạt Hình Ảnh
- Màu sắc vùng trên/dưới có thể điều chỉnh
- Kiểm soát độ mờ (0–255) cho lớp phủ trong suốt
- Nhãn tùy chọn phản ánh động các hệ số bạn chọn
- Thiết Kế Lớp Phủ
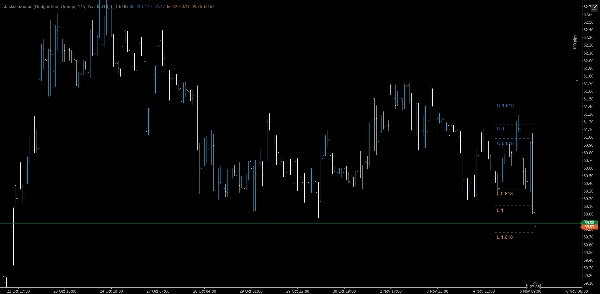
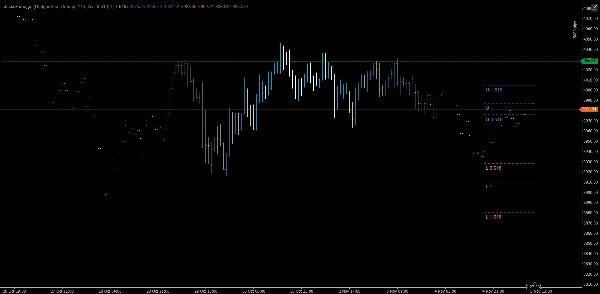
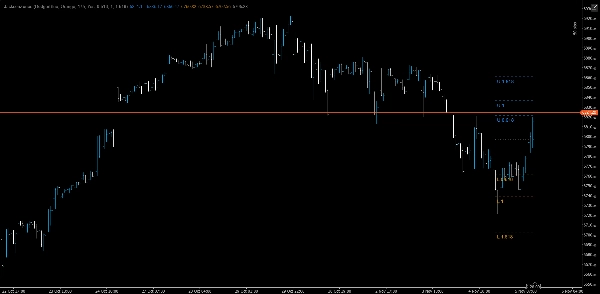
Các vùng và điểm xoay được vẽ trực tiếp trên biểu đồ giá để có bối cảnh ngay lập tức.
🧠 Các Trường Hợp Sử Dụng
• Xác Nhận Phá Vỡ: Các chuyển động mạnh qua vùng 1.000 hoặc 1.618 thường báo hiệu sự tiếp diễn.
• Phát Hiện Đảo Chiều: Thất bại tại các vùng 0.618 hoặc 1.000 cho thấy sự kiệt sức.
• Quản Lý Giao Dịch: Sử dụng các vùng để đặt điểm dừng, mở rộng quy mô hoặc mục tiêu lợi nhuận.
• Neo Phiên: Các vùng được đặt lại hàng ngày, thích ứng với biến động thay đổi đồng thời tôn trọng khoảng trống cuối tuần.
Tóm tắt
Đánh giá của khách hàng
5 | 0 % | |
4 | 100 % | |
3 | 0 % | |
2 | 0 % | |
1 | 0 % |


![Logo "[Hamster-Coder] Bollinger Bands"](https://cdn.ctrader.com/image/webp/21d8e5d6-fb11-4bac-b9ee-cd05c2b76804_30327)


