📈 偏斜波动率偏差指标 – 专业版(适用于 cTrader)
通过偏斜波动率偏差指标,深入了解市场压力、波动率不平衡和方向性信念。这是一个基于经典波动率方法的增强版本,最初受 Pine Script 启发,现在已完全优化适用于cTrader。
该工具帮助交易者可视化市场哪一方冲击更强烈——买方还是卖方——通过测量波动率不对称性并将其转换为清晰易读的信号。
无论您交易指数、外汇、商品还是加密货币,该指标都是强大的趋势过滤器、状态检测器和偏差确认工具。
1. 偏斜指标测量内容
该指标评估多头与空头蜡烛之间的波动率平衡。
它计算归一化的真实波幅并输入两个自适应平均值:
- 最大偏差 → 多头蜡烛期间产生的波动率
- 最小偏差 → 空头蜡烛期间产生的波动率
然后计算:
👉 偏斜 = 最大偏差 / 最小偏差
这将原始波动率转换为清晰的方向性读数:
- 偏斜 > 1 → 上涨走势平均更强
- 偏斜 < 1 → 下跌走势更强
- 偏斜 ≈ 1 → 波动率对称,市场平衡
简而言之:
偏斜揭示了哪一方拥有“波动率主导权”。
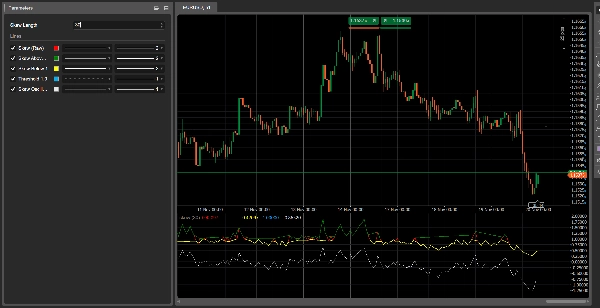
2. 理解各条线
1. 偏斜(原始) – 红线
纯波动率比率。这是核心信号。
2. 偏斜高于 1 – 绿线
显示多头波动率主导。
3. 偏斜低于 1 – 黄线
显示空头波动率主导。
4. 阈值 1.0 线 – 蓝色虚线
代表均衡。
5. 偏斜振荡器(对数) – 白线
更稳定、更平滑的表现:
- 大于 0 = 多头波动率
- 小于 0 = 空头波动率
3. 如何解读
A) 市场状态
🔹 多头状态
- 偏斜 > 1
- 绿线激活
- 振荡器高于零
→ 市场偏好多头。
🔹 空头状态
- 偏斜 < 1
- 黄线激活
- 振荡器低于零
→ 市场偏好空头。
🔹 中性
- 偏斜 ≈ 1
→ 市场平衡,适合区间交易。
4. 状态转换信号
偏斜上穿 1
→ 买方获得波动率主导权
→ 多头转换
偏斜下穿 1
→ 卖方获得波动率主导权
→ 空头转换
这些转换通常发生在价格行为确认趋势之前,使偏斜成为强大的早期指标。
5. 实际应用案例
1️⃣ cBots 的趋势过滤器
- 仅当 SkewOsc > 0 时做多
- 仅当 SkewOsc < 0 时做空
2️⃣ 趋势质量确认
- 上升趋势 + 偏斜 > 1 = 强势趋势
- 上升趋势 + 偏斜向 1 下降 = 趋势减弱
3️⃣ 市场情绪 / 风险过滤器
对指数和主要外汇货币对特别有效。
6. 总结
- 它显示了: 波动率主导权
- 重要原因: 波动率变化先于价格变化
- 使用方法: 作为过滤器、确认工具或情绪指标
- 最佳特点: 极其轻量、快速且适应性强
5 | 67 % | |
4 | 33 % | |
3 | 0 % | |
2 | 0 % | |
1 | 0 % |