present
Đăng ký và nhận ưu đãi $50 cho lần mua đầu tiên
Trading product for RegimeVisualizer Chỉ báo Flag Volume, image 1
RegimeVisualizer
Chỉ báo
Phiên bản 1.0, Jul 2026
Windows, Mac
Trading product for RegimeVisualizer Chỉ báo Flag Volume, image 2
Trading product for RegimeVisualizer Chỉ báo Flag Volume, image 3
Trading product for RegimeVisualizer Chỉ báo Flag Volume, image 4
Trading product for RegimeVisualizer Chỉ báo Flag Volume, image 5
Kể từ 11/01/2025
14.87M
Khối lượng đã giao dịch
1.06M
Pip đạt được

Mô tả

The problem with regime indicators: they change their minds.

Most regime indicators "learn" from the data while they run. You know the result: the history looks beautiful, because the labels of past bars were silently rewritten after the future arrived. This has a name — repainting — and it is the cardinal sin of any analysis tool: it looks reliable precisely because it erases its own mistakes.

Regime Visualizer makes a single promise: it never repaints.

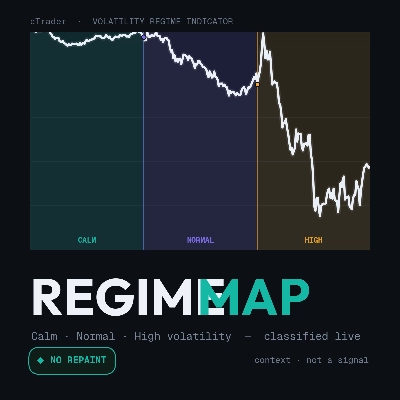
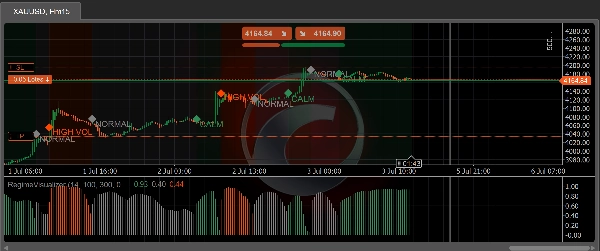
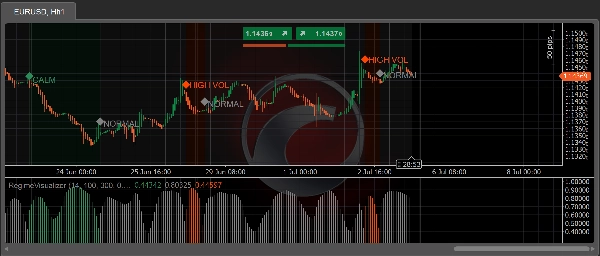
Every bar is classified into one of three volatility regimes — Calm, Normal or High — at the moment it closes. That label is final. It is never recalculated, smoothed or retroactively corrected. The screenshot you take today shows the same thing that was on the screen live, bar by bar. Deterministic: same data, same picture, on every run.

What you see on the chart:

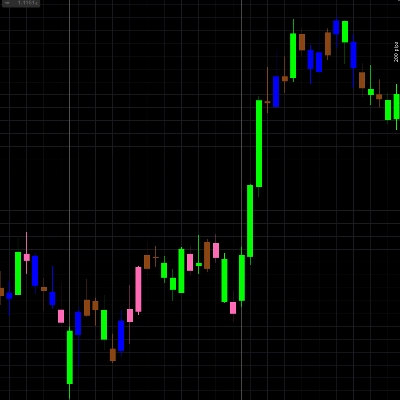
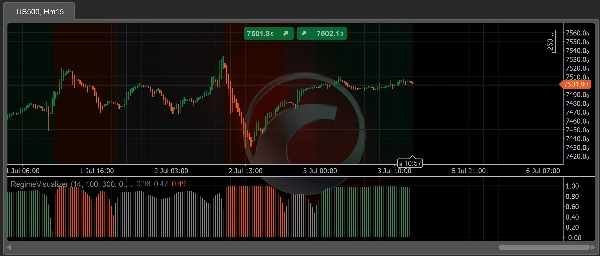
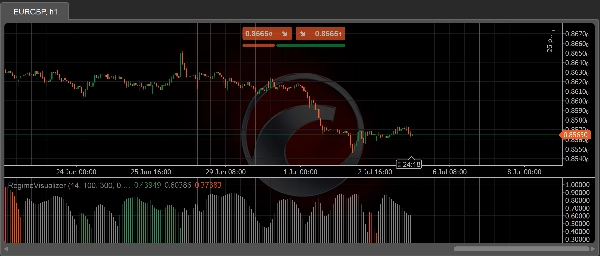
  • 🎨 Colored background per regime segment, right on the price chart
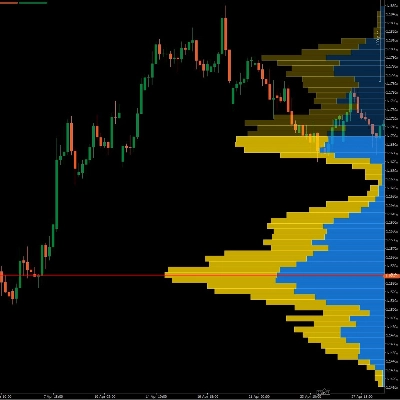
  • 📊 Confidence histogram (0–1) in a separate panel — the filtered probability of the active regime, in the regime's color
  • 🔷 Transition marker — icon + label on the bar where the regime changes
  • Each layer toggles on/off independently, with configurable colors

What it is NOT (read before installing):

  • ❌ Not a trading signal. It never tells you to buy or sell.
  • ❌ No performance promise. Volatility regime does not predict profit — this indicator makes context readable, nothing more. What you do with it is your responsibility.
  • ❌ Not adaptive. There is no online learning — on purpose: "learning while running" is exactly what makes regime indicators repaint.

How it works (for those who want to know):

A 3-state hidden Markov model (HMM) with fixed parameters runs on normalized ATR (ATR(14) / 100-bar ATR average — dimensionless, so it works on any instrument and timeframe). Inference is forward filtering only — it uses nothing but data up to the close of the current bar, with no Viterbi and no backward smoothing (the classic sources of repainting). A hysteresis layer with thresholds and a minimum dwell time turns the flickering argmax into a stable read.

Honest about its limits:

  • The first 300 bars (warmup) stay unlabeled — the indicator does not pretend to know what it does not know yet.
  • The forming bar gets no label — it is classified when it closes. That is the price of never repainting, and we pay it in front of you.

For cBot developers:

The indicator exposes the public RegimeCode series (0 = Calm, 1 = Normal, 2 = High, −1 = warmup) for consumption via Indicators.GetIndicator<RegimeVisualizer>(). Non-repainting volatility context, ready to plug into your logic.

Validation (tested, not claimed):

The non-repaint property was verified by a harness that reprocessed 100,000 real bars across 201 incremental windows — 10.1 million label comparisons, zero divergence — plus bit-identical determinism across runs.

Free. Context — not a signal.

Tóm tắt

Hồ sơ chỉ báo
Danh mục chỉ báo
Khối lượng
Loại đầu ra
Hình ảnh trực quan
Yêu cầu dữ liệu
Chỉ dữ liệu nến
Tín hiệu được hỗ trợ
Biến động

Thảo luận

Đánh giá của khách hàng

0.0
Đánh giá: 0
Đánh giá của khách hàng
Sản phẩm này chưa có đánh giá nào. Bạn đã dùng thử chưa? Hãy là người đầu tiên chia sẻ với mọi người!

Câu hỏi thường gặp

Flag
Volume
Market Structure
Supply & Demand
Risk Dashboard
ATR
Liquidity Grab
Các sản phẩm có sẵn trên cTrader Store, bao gồm bot giao dịch, chỉ báo và plugin, được cung cấp bởi các nhà phát triển bên thứ ba và chỉ nhằm mục đích cung cấp thông tin và tiếp cận kỹ thuật. cTrader Store không phải là nhà môi giới và không cung cấp lời khuyên đầu tư, khuyến nghị cá nhân hay bất kỳ đảm bảo nào về hiệu suất trong tương lai.

Bạn cũng có thể thích

Chỉ báo
BOS
EMA
+5
VWAP Bands indicator with 3 standard deviation levels, buy/sell zones, and a draggable ON/OFF button to toggle the entir
Chỉ báo
Volume
Key Levels
Dynamic Visible Range Volume Profile for cTrader. Real-time POC, Value Area & Smart Alerts for precise trading.
Chỉ báo
BW_MFI Vizual colors bars
Chỉ báo
Volume
Key Levels
+1
Session volume profiles from tick volume: POC, value area high and low, and naked POCs extended until touched.
Chỉ báo
Customize your Moving Average! Choose any timeframe and price source for precision and flexibility in your analysis.
Chỉ báo
ATR
BOS
+5
Opening ranges, dynamic trend channels, and multi-scale breakout/retest analysis for clear intraday chart decisions.
Chỉ báo
Forex
Customizable Dynamic Fibonacci Channels and Smart Alerts
Chỉ báo
EMA
RSI
+2
Advanced TDI indicator with Shark Fin signals, chart arrows, MTF RSI, divergence detection and smart alerts.
Chỉ báo
Doji
Volume
+5
Instantly spot high-liquidity institutional moves with clean, non-obtrusive triangle alerts on cTrader charts.
Chỉ báo
Breakout
3 bar triangle = high below 2 day high, low above 2 day low
Chỉ báo
AI
SMC
+18
Smart Money Concepts (SMC)
Chỉ báo
🌟 HTF indicator for cTrader! Real-time higher timeframe candles (1W-1H) on your chart.
Chỉ báo
Fibonacci
Key Levels
+1
Explore Elliott wave counts, three swing sizes and example levels with an interactive cTrader chart panel.
Chỉ báo
SMC
Prop
+14
BoS ChoCH Pro,Strict Mode,False Breakout Filter,Average hit rate: 72-78%
Chỉ báo
ATR
Prop
+6
🟢 Strength-ranked S/R zones with MTF levels and Pro labels. Nearest-zone band and HUD for faster, cleaner entries. 🔴
Chỉ báo
Forex
Signal
+4
Gann Pivot Vision is an innovative analytical tool that combines classic pivot reversal levels and Gann geometry
Chỉ báo
CandleCounterAlex – Candle Cycle Counter with Colors and Adjustable Position.
Chỉ báo
Indices
Commodities
The Advanced CCI & EMA Indicator combines the CCI with 40 & 80 EMA logic to generate precise arrows signaling direction

Giá

Kể từ 11/01/2025
14.87M
Khối lượng đã giao dịch
1.06M
Pip đạt được