present
注册即可在首次购物时获得 $50 优惠
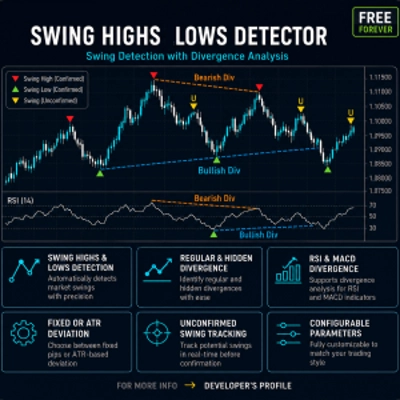
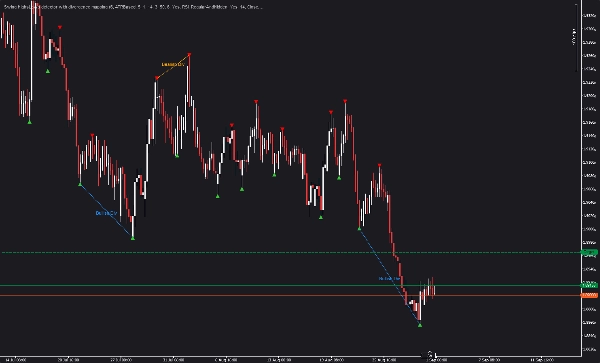
Trading product for Swing HighsLows detector with divergence mapping 指标 Key Levels RSI, image 1
Swing HighsLows detector with divergence mapping
指标
84 下载
版本 1.0, Aug 2026
Windows 版、Mac 版
4.6
评价:5
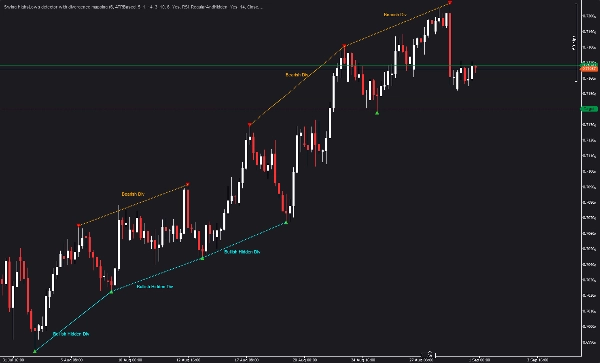
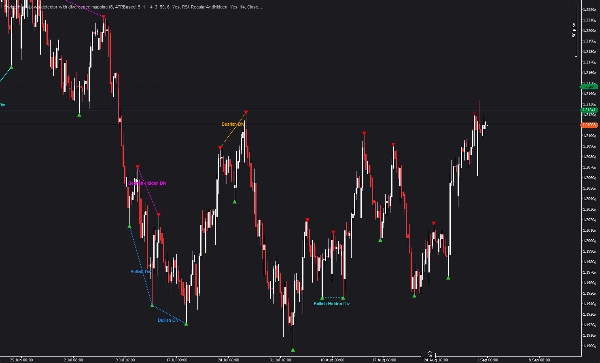
Trading product for Swing HighsLows detector with divergence mapping 指标 Key Levels RSI, image 2
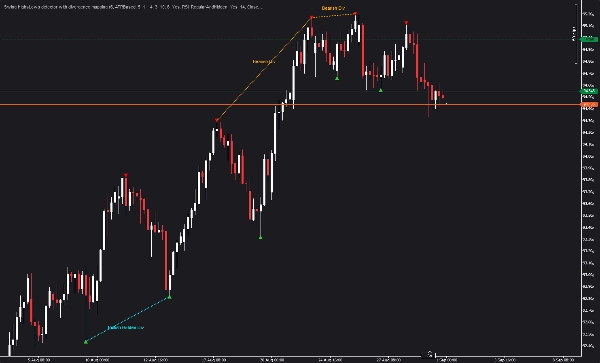
Trading product for Swing HighsLows detector with divergence mapping 指标 Key Levels RSI, image 3
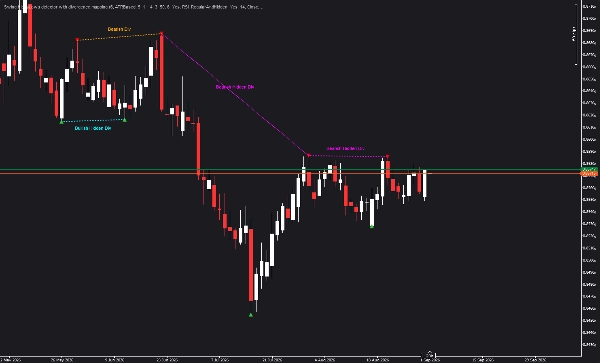
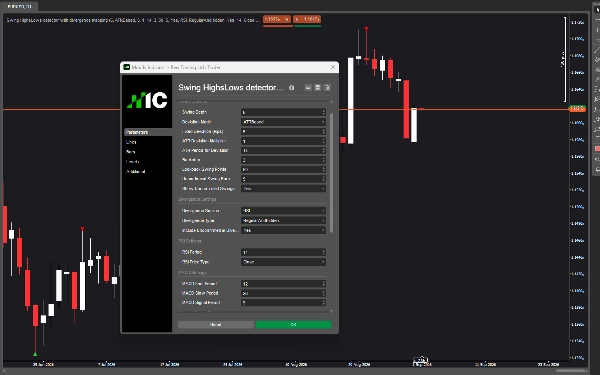
Trading product for Swing HighsLows detector with divergence mapping 指标 Key Levels RSI, image 4
Trading product for Swing HighsLows detector with divergence mapping 指标 Key Levels RSI, image 5
Trading product for Swing HighsLows detector with divergence mapping 指标 Key Levels RSI, image 6
Trading product for Swing HighsLows detector with divergence mapping 指标 Key Levels RSI, image 7
注册日期 14/01/2025
5
销售
419
免费安装

说明

摆动高低点检测器


带背离分析的摆动检测


--------------------------------------------------


识别摆动。发现背离。结合多重因素交易。


--------------------------------------------------


指标功能介绍


该指标使用可配置的深度和偏差过滤自动检测结构性摆动高点和低点。然后分析RSI和MACD,以检测同类型连续摆动之间的常规和隐藏背离。


背离是强有力的反转信号。常规背离表示潜在的趋势反转,而隐藏背离表示潜在的趋势延续。该指标识别两者并直接显示在图表上。


--------------------------------------------------


核心逻辑与计算


该指标使用局部极值算法和可配置深度检测摆动点。每个摆动点通过偏差阈值验证,确保仅显示重要摆动。偏差可以是固定点数或基于ATR的波动性自适应。


识别摆动后,指标计算每个摆动点的RSI和MACD值。然后比较同类型连续摆动(高点对高点,低点对低点)以检测常规和隐藏背离。常规背离发生在价格创出更高高点但RSI/MACD创出更低高点(看跌)或价格创出更低低点但RSI/MACD创出更高低点(看涨)。隐藏背离发生在价格创出更低高点但RSI/MACD创出更高高点(看跌)或价格创出更高低点但RSI/MACD创出更低低点(看涨)。


背离来源可选择RSI、MACD或两者。背离类型可选仅常规、仅隐藏或两者。未确认摆动可包含在背离检测中,提供更早信号。


当前摆动状态机跟踪仍在形成中的未确认摆动(U)。这些摆动以黄色显示,随着价格走势发展可升级为确认或作废。


--------------------------------------------------


主要特点


- 自动摆动检测:使用可配置深度和偏差过滤识别摆动高点和低点。

- 常规背离检测:识别经典背离信号,指示潜在趋势反转。

- 隐藏背离检测:识别隐藏背离信号,指示潜在趋势延续。

- RSI和MACD背离:可选择RSI、MACD或两者作为背离来源。

- 可配置偏差:固定点数或基于ATR的偏差适应市场波动性。

- 未确认摆动跟踪:显示仍在形成中的潜在摆动(U)。

- 回溯控制:限制显示的摆动点数量以优化性能。

- 可自定义颜色:分别为确认的高点、确认的低点、未确认摆动和背离类型设置颜色。

- 无重绘:所有计算基于历史数据。


--------------------------------------------------


参数指南


摆动设置


摆动深度:此参数控制每侧检查多少根K线以确定是否为摆动高点或低点。数值越高,产生的摆动越少且更显著。数值越低,产生的摆动越多。默认值为10。对于较低时间框架如M5和M15,建议使用6到8。对于较高时间框架如H4及以上,建议使用12到16。


偏差模式:此参数选择固定点数和基于ATR的偏差。固定点数使用摆动间的固定最小价格距离。基于ATR的偏差根据波动性自适应,使用当前ATR值的乘数。默认是固定点数。


固定偏差(点数):使用固定点数模式时,此参数设置连续摆动间的最小点数距离。默认值为5.0。增大此值以过滤较小摆动,关注更大结构性波动。减小以捕捉更多摆动。


ATR偏差乘数:使用基于ATR模式时,此参数乘以当前ATR值以确定最小偏差。默认值为0.5。数值越高,摆动越少。数值越低,摆动越多。


ATR偏差周期:使用基于ATR模式时,此参数设置ATR计算周期。默认值为14。周期越短,ATR响应越快。周期越长,ATR越平滑。


回溯步长:此参数设置摆动间的最小K线数量。默认值为3。增大此值防止摆动过于接近。减小以允许更频繁的摆动。


回溯摆动点数:此参数限制显示的摆动点数量以优化性能。默认值为50。增大以获得更多历史背景。减小以提升慢速机器的性能。


未确认摆动K线数:此参数设置指标在潜在摆动后检查多少根K线以寻找更优摆动。默认值为3。数值越高,给予更多时间形成更好摆动。数值越低,信号越快。


显示未确认摆动:启用时,潜在摆动(U)以黄色显示,确认前可见。默认启用。禁用则仅显示确认摆动,图表更简洁。


背离设置


背离来源:此参数选择用于背离检测的指标。选项为RSI、MACD或RSIAndMACD。RSIAndMACD要求两个指标均显示背离才生成信号。默认是RSI。


背离类型:此参数选择检测的背离类型。选项为仅常规、仅隐藏或常规和隐藏。默认是常规和隐藏。


包含未确认摆动于背离:启用时,未确认摆动可作为当前摆动参与背离检测。默认启用。禁用则要求两个摆动均完全确认后才显示背离。


RSI设置


RSI周期:此参数设置RSI计算周期。默认值为14。标准值范围为9到25。周期越短,RSI越敏感。周期越长,RSI越平滑。


RSI价格类型:此参数选择用于RSI计算的价格序列。选项包括收盘价、开盘价、最高价、最低价、典型价、中位价和加权价。默认是收盘价。


MACD设置


MACD快速周期:此参数设置MACD计算的快速EMA周期。默认值为12。


MACD慢速周期:此参数设置MACD计算的慢速EMA周期。默认值为26。


MACD信号周期:此参数设置MACD计算的信号线周期。默认值为9。


视觉效果


高摆动颜色:确认摆动高点的颜色。默认红色。


低摆动颜色:确认摆动低点的颜色。默认青柠绿。


未确认高摆动颜色:未确认摆动高点(U)的颜色。默认黄色。


未确认低摆动颜色:未确认摆动低点(U)的颜色。默认黄色。


看涨常规背离颜色:看涨常规背离线颜色。默认道奇蓝。


看跌常规背离颜色:看跌常规背离线颜色。默认橙色。


看涨隐藏背离颜色:看涨隐藏背离线颜色。默认青色。


看跌隐藏背离颜色:看跌隐藏背离线颜色。默认品红色。


显示标签:启用时,背离标签显示在图表上。默认启用。


标签字体大小:此参数设置背离标签的字体大小。默认值为8。


背离标签偏移(点数):此参数控制背离标签相对于背离线的偏移距离。默认值为10。


--------------------------------------------------


使用场景


- 识别结构性摆动高点和低点以进行市场结构分析

- 检测常规背离以获取潜在反转信号

- 检测隐藏背离以获取潜在趋势延续信号

- 将背离信号与价格行为结合,提高交易概率

- 使用RSI和MACD背离确认进出场决策

- 跟踪未确认摆动以实现早期信号检测


--------------------------------------------------


推荐工作流程


步骤1:将指标附加到图表,使用默认设置。

步骤2:识别确认的摆动高点和低点(红色和绿色三角形)。

步骤3:寻找连接连续摆动的背离线(蓝色、橙色、青色、品红色)。

步骤4:将常规背离解读为潜在反转,隐藏背离解读为潜在延续。

步骤5:在入场交易前,用价格行为或其他指标确认背离信号。


--------------------------------------------------


技术说明


- 叠加指标,直接绘制在价格图表上

- 适用于任何时间框架和品种

- 可配置的摆动检测和背离参数

- 无重绘;所有计算基于历史数据

- 通过回溯控制优化性能

- 兼容cTrader


--------------------------------------------------


支持


包含终身更新。


更多信息 - 点击下方开发者资料。

摘要

AI 摘要
This indicator automatically detects structural swing highs and lows on price charts using configurable depth and deviation filters, adaptable via fixed pips or ATR-based volatility measures. It analyzes RSI and MACD momentum indicators to identify both regular and hidden divergences between consecutive swings of the same type. Regular divergences signal potential trend reversals, while hidden divergences suggest trend continuations. Users can select divergence sources (RSI, MACD, or both) and divergence types (regular, hidden, or both). The indicator tracks unconfirmed swings in real-time, displaying them distinctly to provide early signals. Visual elements include customizable colors for confirmed and unconfirmed swings and divergence lines, with optional labels for clarity. It operates as an overlay on any timeframe and symbol within the cTrader platform, using historical data only to avoid repainting. Performance is optimized through lookback limits on swing points. Key parameters allow users to tailor swing detection sensitivity, divergence criteria, and visual presentation. Typical use cases include market structure analysis, identifying reversal and continuation signals, and combining divergence with price action for trade decision support. The indicator supports systematic swing and divergence analysis to assist traders in interpreting momentum shifts and structural price changes.
指标配置
指标分类
支撑与阻力
输出类型
可视化
信号
过滤器
数据要求
仅 K 线
支持的信号
背离
突破
反转
趋势强度
波动性
触及水平位
突破水平位

讨论

客户评价

4.6
评价:5
5
60 %
4
40 %
3
0 %
2
0 %
1
0 %
客户评价
October 28, 2026
Depth and deviation are useful controls rather than decoration here. They determine which swings enter the RSI or MACD divergence map, with both regular and hidden patterns available. A fairly focused option for adding oscillator context to market structure.
October 15, 2026
Giving unfinished swings a visibly different status is an excellent detail. It makes these RSI and MACD divergence markings easier to interpret without confusing a developing idea with confirmed structure. That distinction is more valuable than simply drawing more lines.
October 11, 2026
Tested on EURUSD and XAUUSD across H1 and M1. Swing highs/lows and divergence mapping rendered clearly, with bullish, bearish and hidden divergences visible across the tested history. The configurable structure and color separation make the tool easy to read, while historical objects remained consistent. No visible functional issues were found.
October 2, 2026
swing structure gives the regular and hidden RSI or MACD divergence markings a clearer purpose. Depth and deviation adjust what qualifies, with developing swings kept distinct from confirmed ones rather than treating every oscillator wiggle alike.
October 1, 2026
Hidden divergence gets the same attention as the regular kind, which adds real depth to the swing analysis. The adjustable depth and deviation keep the mappings tied to a defined structure. A thoughtful approach for anyone studying how oscillator behaviour relates to price swings.

常见问答

Key Levels
RSI
BOS
Market Structure
ATR
MACD
Support & Resistance
cTrader Store 提供的所有产品,包括交易机器人、指标和插件,均由第三方开发者提供,仅供信息参考和技术访问之用。cTrader Store 并非经纪商,不提供投资建议、个人推荐或任何未来业绩保证。

该作者的其他作品

指标
ATR
RSI
+5
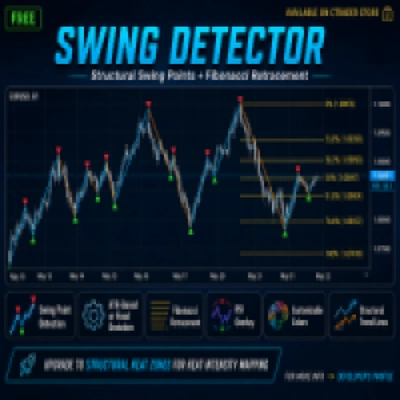
Free swing detector with Fibonacci retracement and RSI overlay. Auto-deviation adapts to any timeframe
指标
Volume
Imbalance
+1
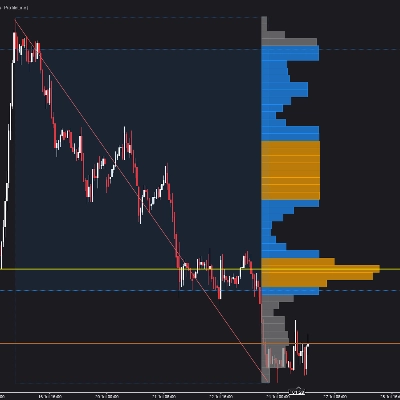
Volume profile indicator that auto-detects the latest trendline. Shows POC, Value Area (VAH/VAL), and High Volume Nodes
指标
ATR
RSI
+4
VWAP with ATR ribbon bands and RSI labels on completed breakouts — live forming labels on cTrader.
指标
BOS
Flag
+5
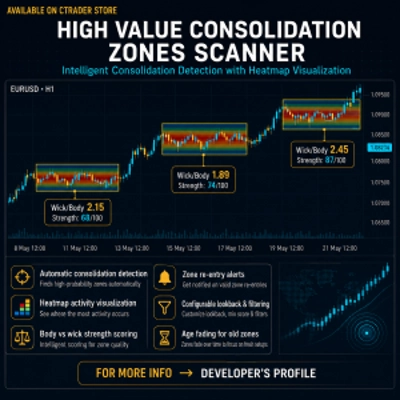
Detect consolidation zones. Heatmap shows activity density. Body vs wick scoring reveals true strength zones.
指标
ATR
EMA
+5
Multi-factor volatility squeeze detector, dual-trend scoring & breakout validation dashboard. No repaint.
指标
EMA
Channel
+3
Real-time squeeze detection, dual-horizon trend scoring & institutional breakout validation HUD dashboard.
指标
ATR
RSI
+5
Multi-factor VWAP mean-reversion signals with ATR bands, volume exhaustion, and RSI gate on cTrader.
指标
MSS
Volume
+3
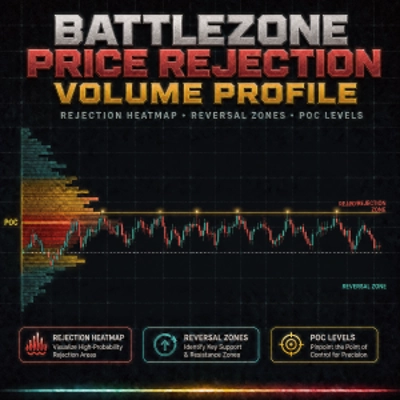
Rejection-based volume profile with tiered heat zones, POC levels and a fully draggable anchor on cTrader.
cBot
ATR
Wedge
+5
15 YEARS RESULTS :Win rate:93% | ROI+19000% | Trades:87,000 | Profit Factor 1.2 | Currency Pairs:22 | $10k to 500k$ |
1.2
盈利系数
指标
MSS
VWAP
+5
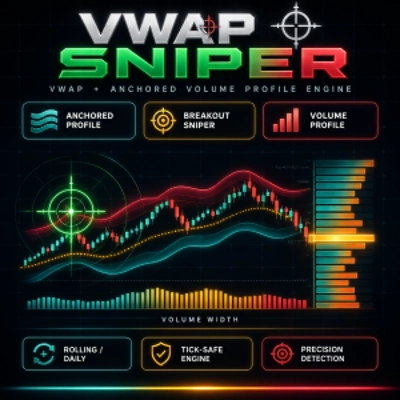
VWAP mean-reversion signals combined with a ribbon-anchored volume profile, VAH/VAL, POC and HVN levels.
指标
ATR
BOS
+5
Heat intensity mapping of structural participation. See where price fights, where it accepts, and where it rejects .
指标
RSI
Volume
+3
Auto-detects swings, Includes POC, Value Area (VAH/VAL), High Volume Nodes (HVN), Fibonacci retracement, and RSI overlay

猜您喜欢

指标
ATR
MSS
+5
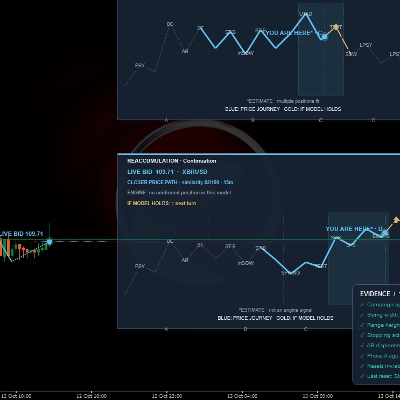
Advanced market structure and institutional cycle mapper with visual reference cards and entry alerts
指标
SMC
VWAP
+5
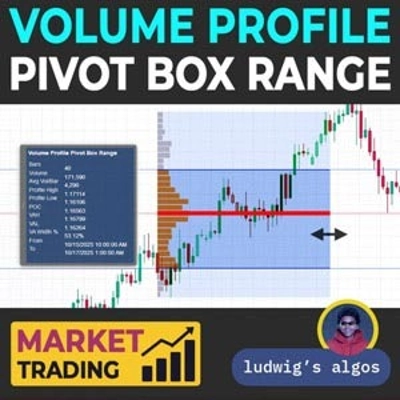
Most advanced Volume Profile Pivot Box indicator — auto pivots, volume zones, smart candle coloring & SMC trading tool.
指标
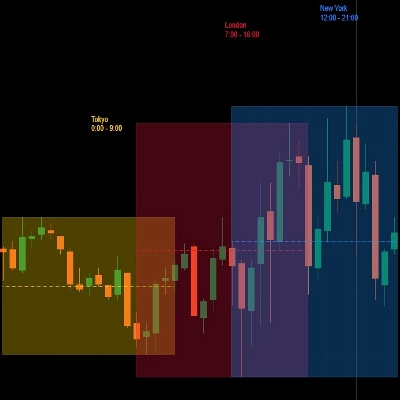
Market Sessions
指标
ATR
EMA
+5
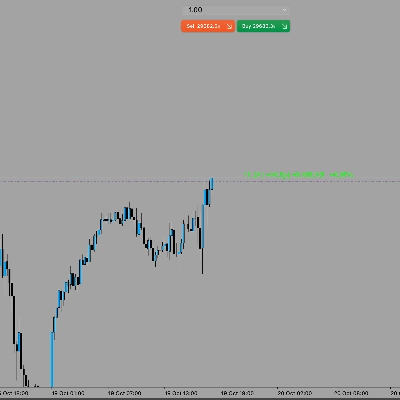
Candle timer with live profit tracking on chart – displays pips, currency value, and percentage in real time.
指标
Volume
Key Levels
KasePeakOscillator: Advanced volatility-adjusted momentum tool with automated peak detection and divergence alerts.
指标
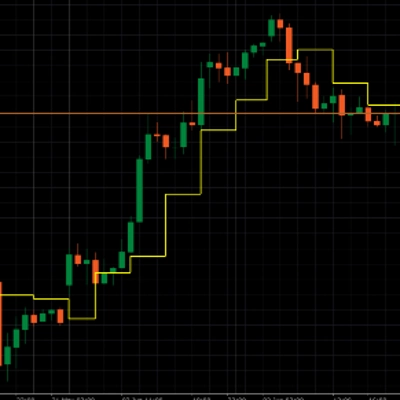
It draws a step line that visualize the movement of H4. Particularly effective when trade on lower timeframe.
指标
ADX
ATR
+5
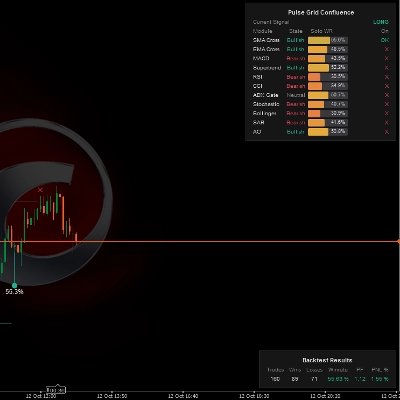
Multi-indicator confluence HUD & real-time backtest engine to detect trend alignment and filter high-probability setups.
指标
Forex
Crypto
+5
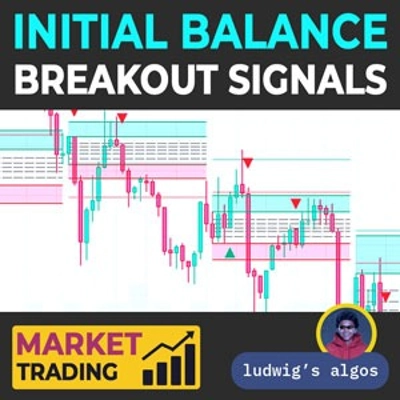
📈 Initial Balance Breakout Signals: visually accurate IB levels, breakout alerts & forecast zones for smart trading.
指标
Signal
Supertrend
Multi-symbol multi-timeframe SuperTrend panel with watchlist, one-click jump, and alerts.
指标
BOS
CHOCH
+3
Clean structure-analysis indicator with BOS/CHoCH context and virgin Fair Value Gaps for cTrader traders.
指标
ATR
Key Levels
+1
Explore 88 harmonic price-pattern variants with interactive chart controls and geometric reference levels.
指标
Forex
Crypto
+2
A powerful cTrader indicator with customizable Moving Average alerts, notifications, and automated trading actions.
指标
AI
ATR
+23
Candle Timer best used for Scalper
指标
AI
Prop
+8
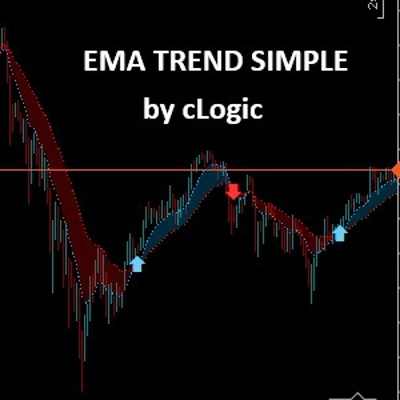
The EMA Trend Simple is a trend-following tool designed for simplicity and visual clarity.
指标
RSI
MACD
+2
A straightforward yet effective tool signals entry points for both buying and selling. Include 3 Moving Average
指标
BOS
MSS
+5
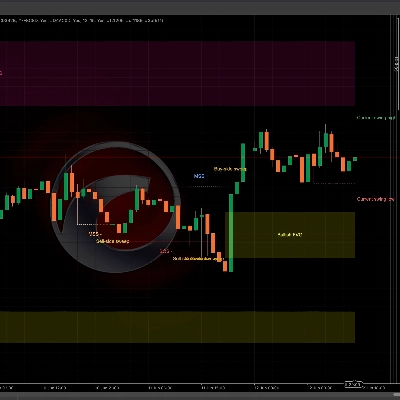
WinSMC is an overlay SMC indicator for cTrader. It helps you visually identify!
指标
BOS
CHOCH
+5
BOS/CHoCH signals confirmed by liquidity sweep + FVG confluence, with a live conviction score.
指标
Fibonacci
Key Levels
+1
Explore Elliott wave counts, three swing sizes and example levels with an interactive cTrader chart panel.

价格

注册日期 14/01/2025
5
销售
419
免费安装