

Description
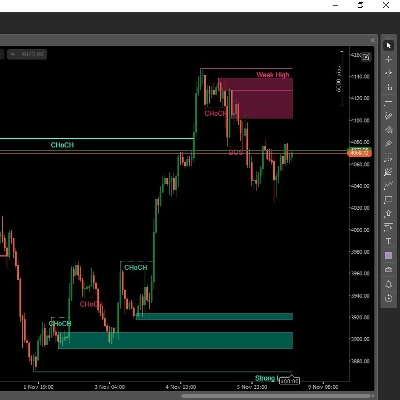
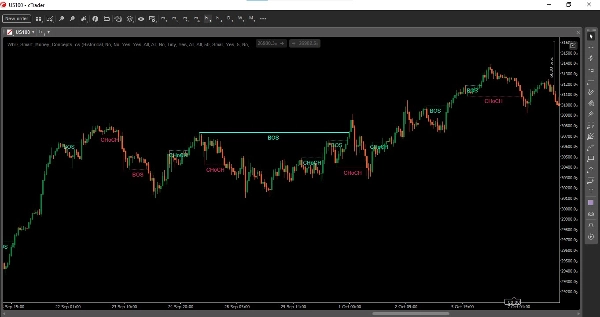
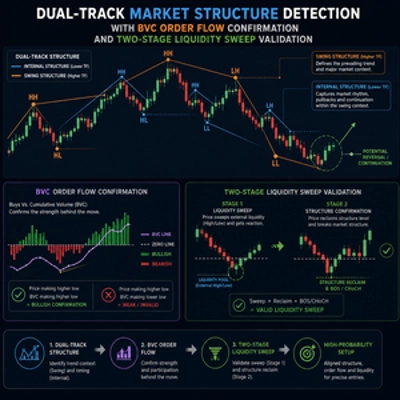
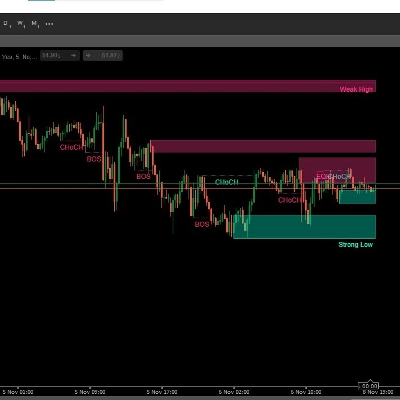
WbD Smart Money Concepts Indicator for cTrader DesktopThis indicator draws market structure, order blocks, and key levels directly on the chart in cTrader Desktop (Windows and Mac).How it works1. Market Structure - BOS and CHoCH
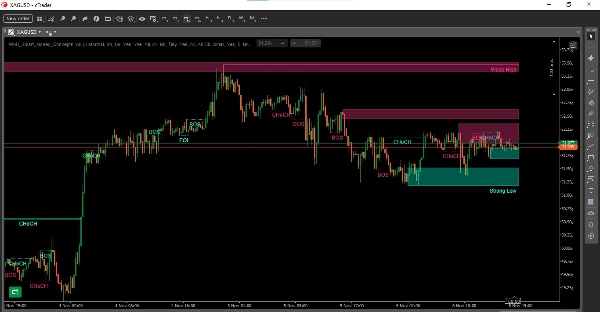
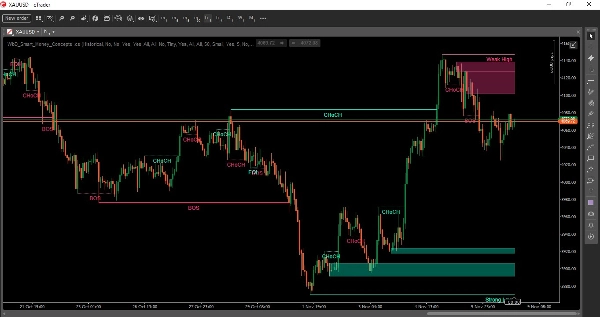
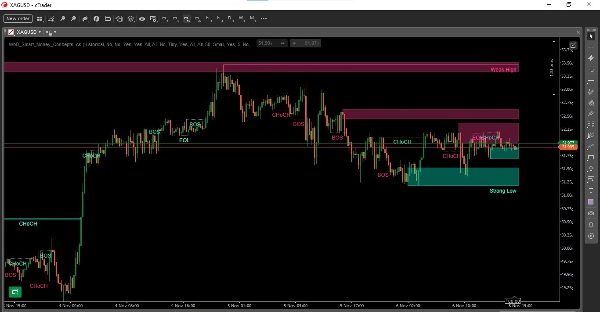
The indicator tracks swing highs and lows and internal highs and lows using a pivot calculation.When price closes above a previous high, it draws a line and labels it BOS (Break of Structure) if the trend continues, or CHoCH (Change of Character) if the trend changes direction.The same logic applies for breaks below previous lows.You can show internal structure and swing structure separately, and filter labels to show All, BOS only, or CHoCH only.2. Swing Points
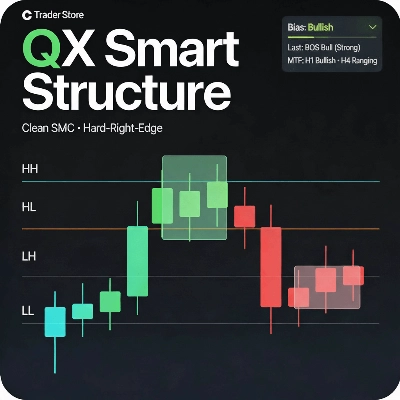
Optionally labels swing points as HH, HL, LH, LL based on the comparison of the current pivot to the previous pivot.3. Strong / Weak High and Low
Draws the current trailing swing high and low as horizontal lines. The label changes to Strong High / Strong Low or Weak High / Weak Low based on the current swing bias.4. Order Blocks
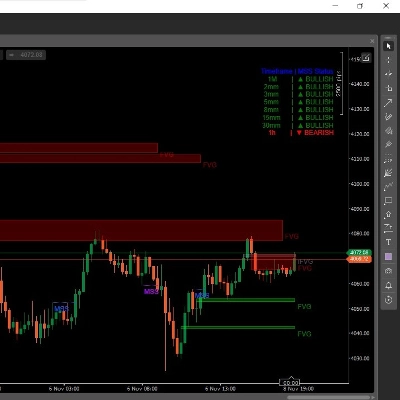
After a BOS or CHoCH, the indicator stores the last opposing candle before the break as an order block and draws it as a filled rectangle.You can show internal order blocks and swing order blocks separately.You can set how many order blocks to show (1 to 20).Order blocks are removed when price mitigates them. You can set mitigation to use High / Low or Close.An ATR-based volatility filter is used to select the order block candle.5. Equal Highs and Lows
Detects when two highs or two lows are within a set threshold based on ATR and a confirmation bar count. Draws a dotted line and labels it EQH or EQL.6. Fair Value Gaps (FVG)
When enabled, it detects a gap between the low of the current bar and the high of the bar 2 bars ago (bullish), or the high of the current bar and the low of the bar 2 bars ago (bearish), and draws it as a filled rectangle. Gaps are removed when price trades through them.7. Premium, Discount and Equilibrium Zones
When enabled, it divides the range between the current trailing high and low into premium (top), equilibrium (middle), and discount (bottom) zones.8. Multi-Timeframe Levels
Optionally draws previous Daily, Weekly, and Monthly high and low levels as horizontal lines, labelled PDH / PDL, PWH / PWL, PMH / PML.Settings
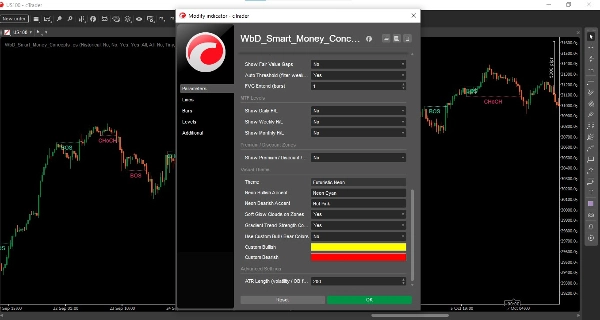
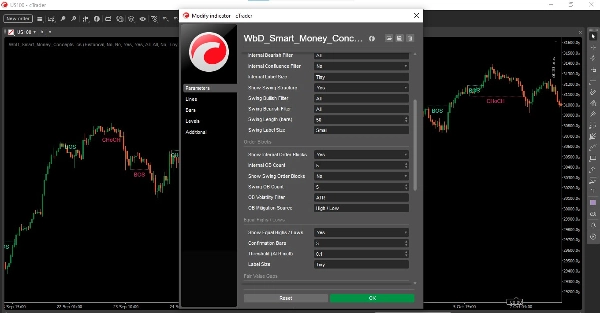
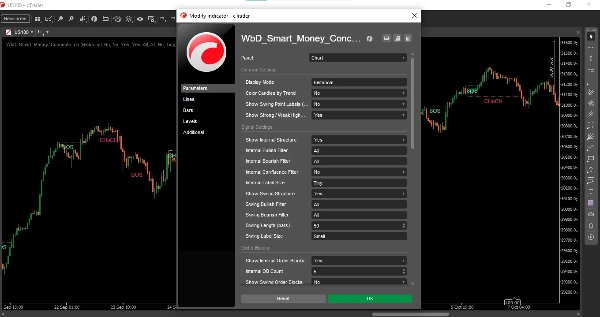
You can turn each group on or off: General Settings, Signal Settings, Order Blocks, Equal Highs / Lows, Fair Value Gaps, MTF Levels, Premium / Discount Zones, Visual Theme, and Advanced Settings. Colour themes, candle colouring, label sizes, swing length, and ATR length are adjustable.Compatibility
Works on cTrader Desktop for Windows and Mac. This is an indicator only. It does not place trades, manage trades, or send orders.Risk Disclaimer
Trading Forex, CFDs, and other leveraged products carries a high level of risk and may not be suitable for all traders. Past performance is not indicative of future results. This indicator is for informational purposes only and is not financial advice. Always test on a demo account and manage your risk.
Summary
It highlights order blocks by marking the last opposing candle before a BOS or CHOCH as a filled rectangle, with customizable display options and mitigation settings based on price or ATR volatility. The indicator detects equal highs and lows within ATR-based thresholds, drawing dotted lines labeled EQH or EQL. It also identifies Fair Value Gaps (FVG) between specific bar lows and highs, visually represented as filled rectangles that disappear when price fills the gap.
Additionally, the indicator divides the current price range into premium, equilibrium, and discount zones and can display multi-timeframe key levels from daily, weekly, and monthly charts. Users can customize visual themes, label sizes, swing lengths, and ATR lengths, and toggle various feature groups on or off. This tool is strictly for analysis and does not execute or manage trades.
Discussion
Customer reviews
FAQ
More from this author



Price