
MeanReversion Indicator
Indikator
142 muat turun
Versi 1.0, Mar 2025
Windows, Mac
4.0
Ulasan: 1
Sejak 21/02/2025
466.3M
Volum yang didagangkan
180.83K
Pip dimenangi
26
Jualan
7.48K
Pemasangan percuma
Penerangan
Ringkasan
AI summary
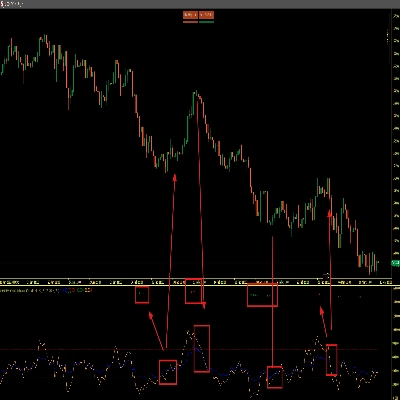
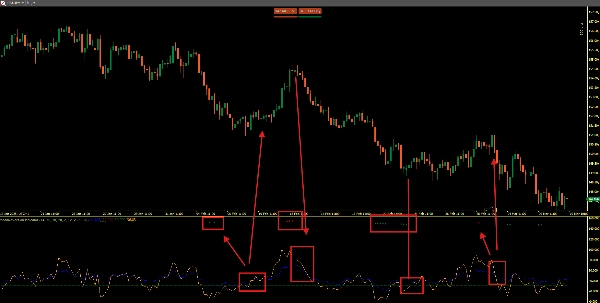
The Mean Reversion Indicator identifies potential market reversal points by integrating multiple technical analysis tools: RSI, Bollinger Bands, MACD, and Volume Analysis. It detects overbought and oversold conditions where prices are likely to revert to their mean. Key features include RSI analysis for condition detection, Bollinger Bands to identify price extremes relative to volatility, MACD for confirming strong reversal signals, and volume analysis to validate market activity supporting the trade setup. The indicator generates clear buy and sell signals with visual markers: a buy signal occurs when price enters an oversold state, crosses the lower Bollinger Band, and is confirmed by MACD and volume; a sell signal triggers when price enters an overbought state, crosses the upper Bollinger Band, and is similarly confirmed. This tool is suited for traders targeting short-term price reversals, particularly in range-bound or mean-reverting markets.
Profil indikator
Ulasan pelanggan
4.0
Ulasan: 1
5 | 0 % | |
4 | 100 % | |
3 | 0 % | |
2 | 0 % | |
1 | 0 % |
Ulasan pelanggan
August 12, 2025
Pros: Adaptive moving average combining SMA with dynamic correlation to reduce lag and smooth price noise. Flexible sensitivity settings. Cons: No alerts or tooltips. No template saving. Can produce noise on low-end PCs or very short timeframes.
Perbincangan
Soalan Lazim
Produk yang tersedia melalui cTrader Store, termasuk bot dagangan, indikator dan plugin, disediakan oleh pembangun pihak ketiga dan diberikan akses untuk tujuan maklumat dan teknikal sahaja. cTrader Store bukan broker dan tidak memberikan nasihat pelaburan, syor peribadi atau sebarang jaminan prestasi masa hadapan.




























Harga
Sejak 21/02/2025
466.3M
Volum yang didagangkan
180.83K
Pip dimenangi
26
Jualan
7.48K
Pemasangan percuma