
Opis
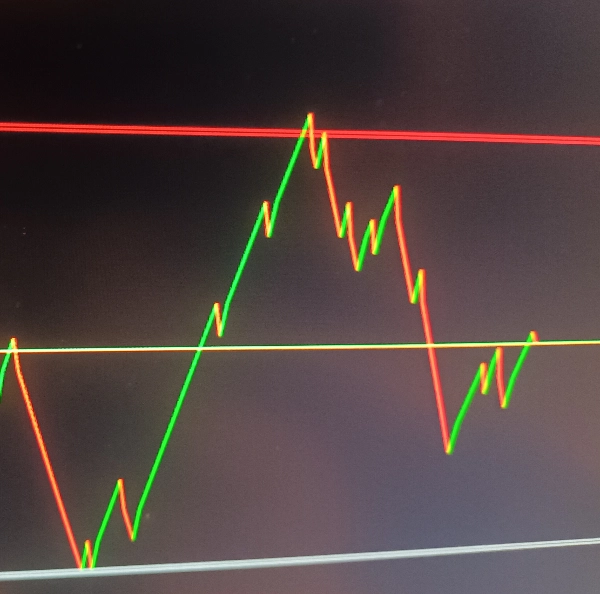
Trend Visual:
Rysuje linie trendu (zielone dla trendu wzrostowego, czerwone dla trendu spadkowego) na podstawie zmian kierunku ceny
Rysuje żółtą linię ceny na wykresie
Strefy wsparcia/oporu:
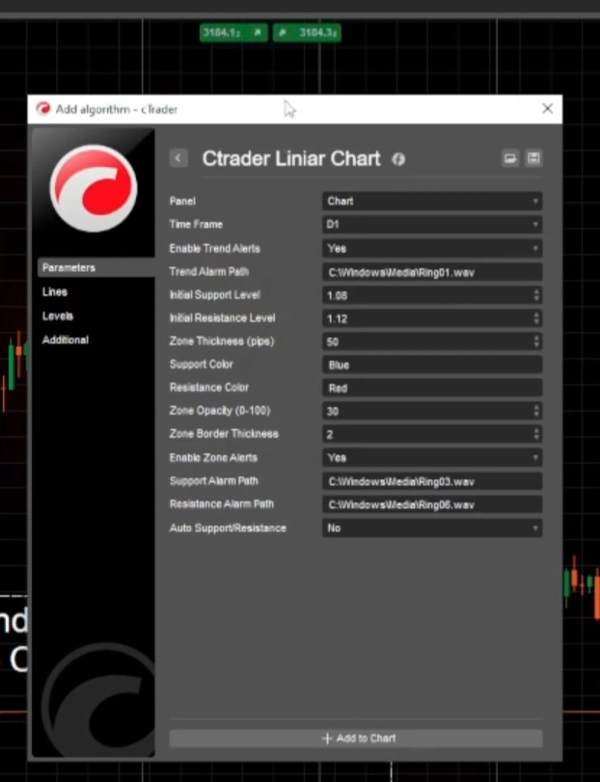
Konfigurowalne poziomy wsparcia i oporu z regulowaną grubością (w pipsach)
Własne kolory i przezroczystość stref
Interaktywne strefy, które można ręcznie dostosować na wykresie
System alertów:
Alerty zmiany trendu (gdy zmienia się kierunek ceny)
Alerty trafienia w strefę wsparcia/oporu
Własne dźwiękowe alerty dla różnych zdarzeń
Automatyczne wsparcie/opór:
Opcjonalna automatyczna regulacja poziomów wsparcia/oporu przy zmianie trendów
Jak to działa
Ustawia wybrany interwał czasowy (domyślnie dzienny)
poziomy wsparcia/oporu z domyślnymi lub zdefiniowanymi przez użytkownika wartościami
Uruchamia timer do okresowego sprawdzania dostosowań stref
Logika obliczeń
Dla każdej świecy porównuje aktualną cenę zamknięcia z poprzednią
Określa aktualny kierunek trendu (wzrostowy/spadkowy)
Rysuje linię trendu między aktualną a poprzednią ceną
Jeśli zmienia się kierunek trendu:
Opcjonalnie automatycznie aktualizuje poziomy wsparcia/oporu
Wyzwala alerty trendu (jeśli włączone)
Sprawdza, czy cena wchodzi w strefy wsparcia/oporu i wyzwala odpowiednie alerty
Zarządzanie strefami
Strefy wsparcia/oporu są rysowane jako półprzezroczyste prostokąty
Strefy można ręcznie dostosować na wykresie, a wskaźnik będzie śledził te zmiany
Grubość strefy jest konfigurowalna w pipsach
Typy alertów
Alerty trendu: wyzwalane, gdy cena zmienia kierunek (wzrost/spadek)
Alerty stref: wyzwalane, gdy cena wchodzi w strefy wsparcia/oporu
Alerty automatycznych poziomów: gdy automatyczne wsparcie/opór jest włączone, alerty przy automatycznej regulacji poziomów
Wybór interwału czasowego
Włączanie/wyłączanie różnych typów alertów
Ścieżki do plików dźwiękowych dla różnych alertów
Poziom wsparcia/oporu .
Podsumowanie
The indicator features configurable support and resistance zones displayed as semi-transparent rectangles, with adjustable thickness in pips, customizable colors, and opacity. These zones are interactive and can be manually adjusted on the chart, with the indicator tracking any changes.
An alert system notifies users of trend changes, price entries into support/resistance zones, and automatic adjustments of these levels if the auto-support/resistance feature is enabled. Alerts can be customized with different sound files and can be enabled or disabled individually.
The indicator periodically checks for zone adjustments and updates support/resistance levels automatically when trends change, if configured. It supports time frame selection and provides a comprehensive visual and alert-based approach to monitoring price trends and critical levels in trading charts.


