Trend Strength Signals St3llars33r
Indikator
Versi 1.0, Aug 2025
Windows, Mac
Sejak 26/05/2025
451.48M
Volume trading
61.16K
Pip dimenangkan
15
Penjualan
1.43K
Instal gratis
Deskripsi
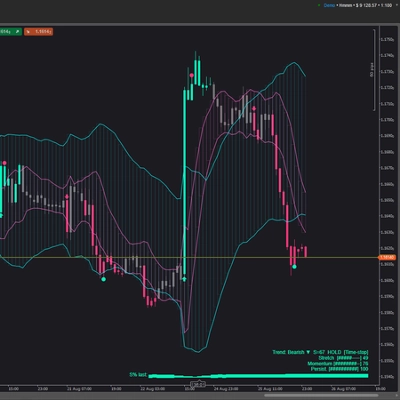
Sebuah toolkit visual untuk perdagangan tren yang memadukan amplop volatilitas dengan saluran yang sadar siklus untuk menunjukkan rezim, waktu, dan risiko secara sekilas. Dirancang agar dapat dibaca di latar belakang apa pun (terang/gelap) dan menjaga layar tetap bersih sambil tetap memberikan petunjuk “apa yang harus dilakukan selanjutnya”.
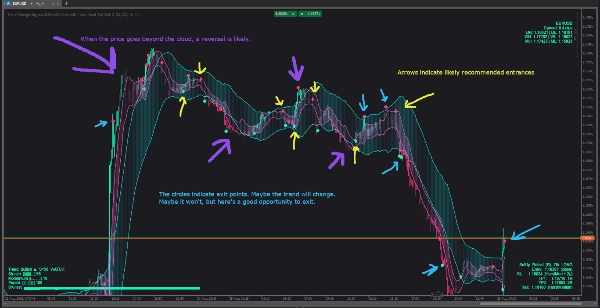
Apa yang Anda lihat di grafik
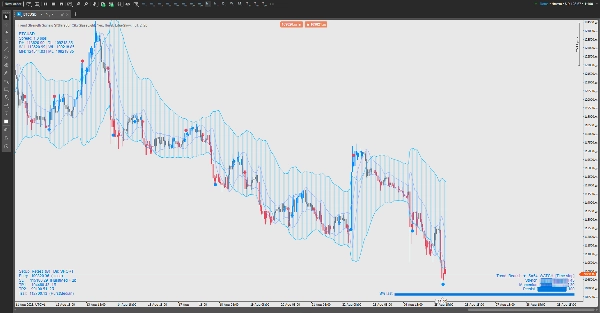
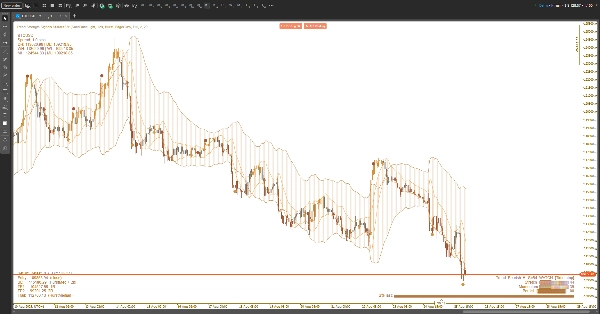
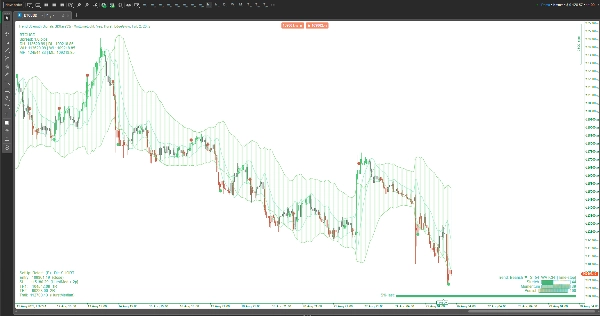
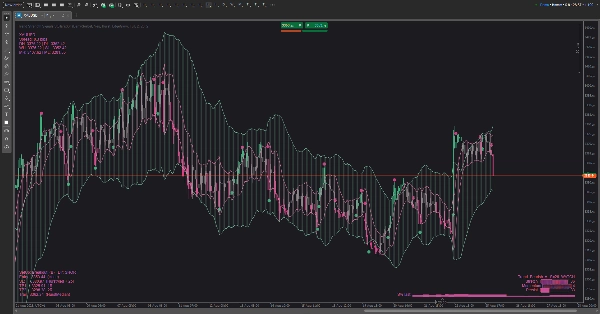
- Awan (dapat diaktifkan/dinonaktifkan):
-
- Sebuah awan volatilitas yang mengembang/mengkerut sesuai aktivitas pasar.
- Sebuah awan siklus yang mengikuti irama bergulir harga.
- Anda dapat menampilkan salah satu, keduanya, atau tidak sama sekali.
- Sinyal: panah naik/turun yang tidak mengganggu untuk potensi pergeseran tren; titik kecil untuk dorongan ambil untung.
- HUD Kekuatan Tren (tiga gaya):
-
- Ringan — tag status yang ringkas.
- Pro — dasbor kecil dengan tiga meteran (regangan, momentum, ketahanan) plus sparkline sejarah mini.
- Pita — batang lembut dekat harga yang intensitasnya mengikuti kekuatan tren.
- HUD Risiko: mengusulkan arah, area stop protektif, dua target keuntungan berlapis, dan ide trailing opsional. Ditempatkan di sudut mana pun yang Anda pilih dan diperbarui seiring perkembangan bar.
- HUD Pasar: simbol & spread, plus referensi tinggi-rendah hari/minggu/bulan, sehingga Anda selalu tahu posisi Anda di dalam peta yang lebih besar.
- Tema: set warna yang dikurasi untuk grafik terang dan gelap (dan mode Kustom). Semua elemen grafis—termasuk HUD dan sinyal—mengikuti tema aktif.
Cara menggunakannya (praktis, bukan teknis)
- Pilih tampilan awan Anda:
-
- Gunakan awan volatilitas untuk melihat penyempitan dan pelebaran.
- Gunakan awan siklus untuk menilai rotasi “tepi” vs “tengah”.
- Gunakan keduanya jika Anda menginginkan konteks + waktu.
- Baca Kekuatan Tren:
-
- Saat status meningkat ke TUNGGU, arahkan perdagangan sesuai arah saat ini; saat turun ke PERHATIKAN, kurangi agresi; jika menunjukkan KELUAR, hindari perdagangan baru atau perketat risiko.
- Dalam mode Pro, meteran yang naik + sparkline yang naik = kualitas membaik; meteran yang memudar = kelola risiko turun.
- Waktu masuk dengan harga vs awan:
-
- Breakout setelah kompresi, masuk kembali setelah pullback sopan ke awan, atau pantulan dari tepi luar adalah pola utama.
- Jika panah awal muncul di tengah bar lalu menghilang, tunggu konfirmasi penutupan bar jika Anda lebih suka lebih sedikit sinyal palsu.
- Kelola perdagangan dengan HUD Risiko:
-
- Tempatkan stop protektif kira-kira di luar batas struktural terdekat yang ditandai HUD.
- Keluar sebagian di TP1, biarkan sisanya menuju TP2 atau ikuti garis trailing yang disarankan.
- Jika Kekuatan Tren melemah dari kuat ke lemah, pertimbangkan keluar lebih awal.
- Filter situasional:
-
- Hindari masuk saat awan tipis dan berombak, atau saat status kekuatan berada di KELUAR.
- Favoritkan perdagangan saat kekuatan meningkat, awan miring, dan harga berinteraksi dengan bersih dengan tepi.
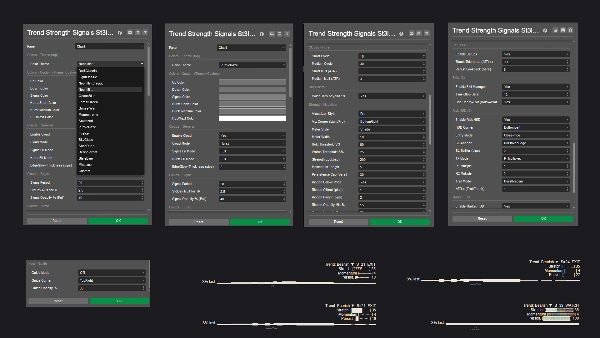
Kustomisasi
- Ganti sudut HUD, gaya visualisasi, dan tema warna agar sesuai dengan ruang kerja Anda.
- Tema yang ramah cahaya menjaga teks tetap terlihat di latar belakang putih; palet laut/hutan/sunset menambahkan kontras halus tanpa silau.
Apa yang bukan
Ini bukan autotrader kotak hitam. Ini adalah alat bantu pengambilan keputusan: membingkai kualitas tren, mengusulkan lokasi risiko yang masuk akal, dan menyoroti momen probabilitas tinggi—tetapi Anda tetap mengendalikan.
Ringkasan
Profil indikator
Ulasan pelanggan
0.0
Ulasan: 0
Ulasan pelanggan
Belum ada ulasan untuk produk ini. Sudah mencobanya? Jadilah pemberi ulasan pertama!
Diskusi
Pertanyaan umum
Produk-produk yang tersedia melalui cTrader Store, termasuk bot trading, indikator, dan plugin, disediakan oleh pengembang pihak ketiga serta hanya ditujukan untuk akses teknis dan informasi. cTrader Store bukan broker dan tidak menyediakan saran investasi, rekomendasi pribadi, atau jaminan apa pun tentang kinerja di masa mendatang.


Harga
Sejak 26/05/2025
451.48M
Volume trading
61.16K
Pip dimenangkan
15
Penjualan
1.43K
Instal gratis