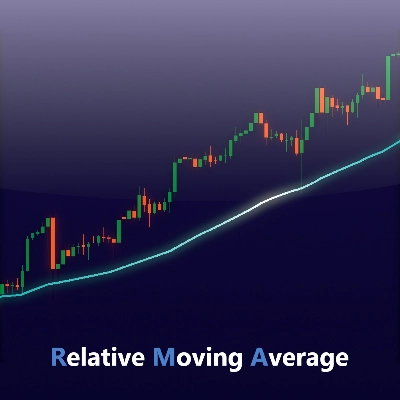
تقديم مؤشر المتوسط المتحرك النسبي (RMA)، المتوفر الآن لـ cTrader!
المتوسط المتحرك النسبي (RMA) — المعروف أيضًا باسم المتوسط المتحرك المملس (SMMA) — هو نوع من المتوسطات المتحركة يهدف إلى تقليل التأخير مع الحفاظ على نعومة المنحنى. إنها نفس الصيغة المستخدمة في دالة "RMA" المدمجة في TradingView، والتي تُستخدم على نطاق واسع في مؤشرات شهيرة مثل مؤشر القوة النسبية (RSI).
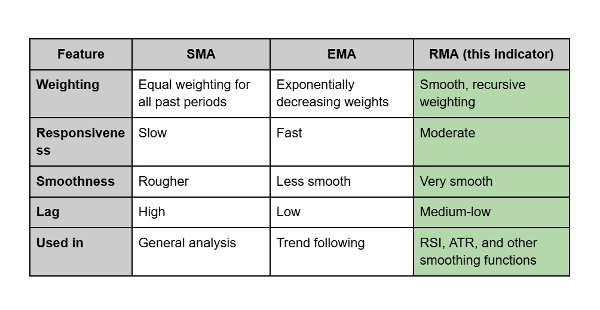
تم تصميم RMA لتحقيق توازن بين الاستجابة والثبات. فهو يتحدث بسلاسة أكثر من المتوسط المتحرك الأسي (EMA) لكنه يتفاعل بسرعة أكبر مع تغيرات السعر مقارنة بـ المتوسط المتحرك البسيط (SMA).
كيف يختلف:
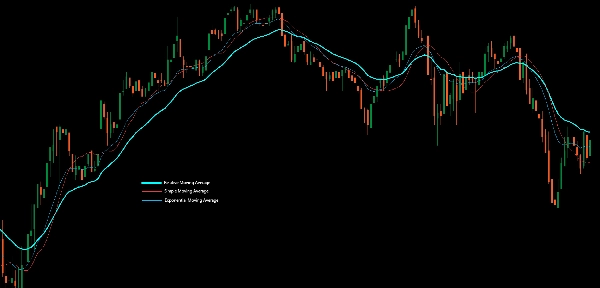
- يقوم SMA بحساب متوسط جميع الأسعار بالتساوي، مما يسبب تأخيرًا وتقلبًا.
- يعطي EMA وزنًا أكبر للأسعار الحديثة، مما يجعله سريع الاستجابة لكنه أحيانًا صاخب.
- بينما يقوم RMA، بالمقابل، بمزج فوائد الاثنين: فهو يملس التقلبات مع الحفاظ على ردود فعل في الوقت المناسب لتغيرات السعر.
الاستخدام العملي:
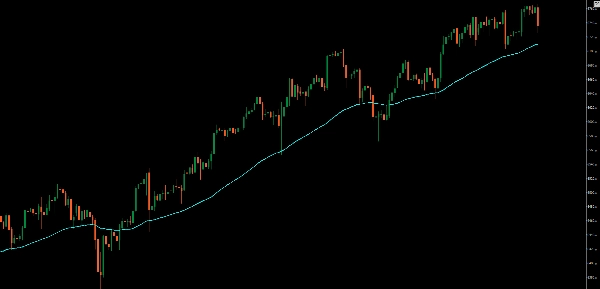
غالبًا ما يستخدم المتداولون RMA كـ خط اتجاه أكثر نعومة أو كجزء من مؤشرات الزخم. إنه فعال بشكل خاص عندما تريد تصفية الضوضاء دون إدخال تأخير كبير — مثالي لتأكيد الاتجاهات طويلة الأمد أو دعم تحليلات التشبع الشرائي/البيعي.


![شعار "[Stellar Strategies] Market Session Ultimate"](https://cdn.ctrader.com/image/webp/61ffd537-0125-4246-9e72-42eca1791d64_28232)


