Multi Time Frame Fair Value Gap (FVG) Indikator
Dieser professionelle FVG-Indikator ist eines der grundlegenden Werkzeuge der Smart Money Concept (SMC) Handelsmethodik und kann Fair Value Gaps in Echtzeit über drei verschiedene Zeitrahmen hinweg identifizieren und anzeigen, inklusive Validierungs- und Minderungstracking.
Hauptmerkmale
Analyse über mehrere Zeitrahmen
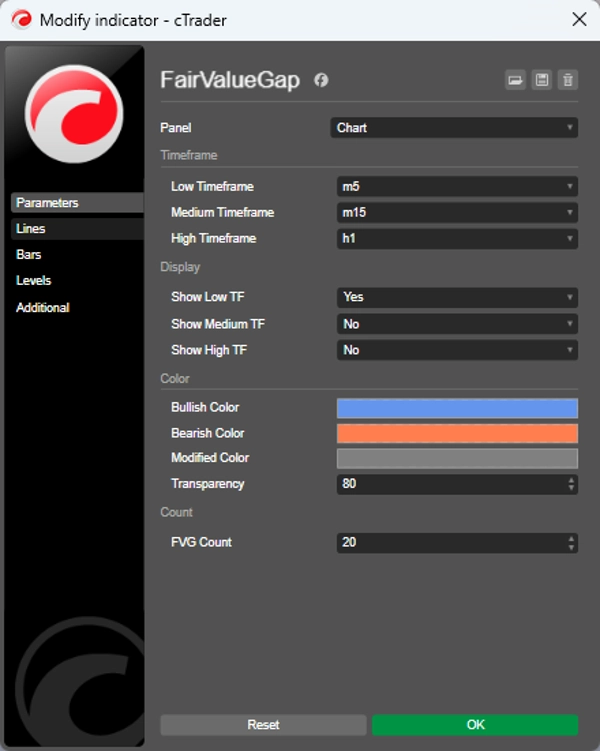
- Gleichzeitige Überwachung von drei individuell konfigurierbaren Zeitrahmen aus einem einzigen Chart
- Individuelle Ein-/Aus-Anzeige für jeden Zeitrahmen
- Visuelle Kennzeichnung für jeden Zeitrahmen (L, M, H) zur einfachen Identifikation
Professionelle Vorteile für Trader
1. Identifikation von Mehrfach-Konfluenz
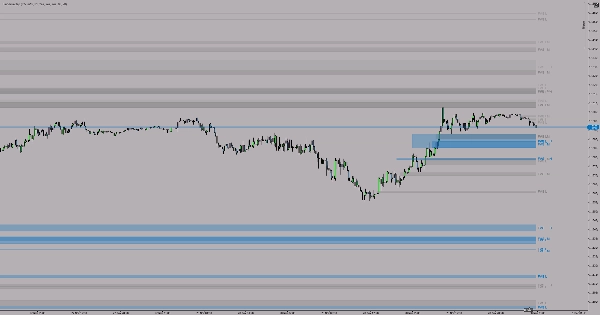
Die gleichzeitige Anzeige von drei Zeitrahmen ermöglicht eine schnelle Identifikation von Konfluenzzonen, in denen FVGs aus verschiedenen Zeitrahmen sich überschneiden. Diese Zonen haben statistisch eine höhere Reaktionswahrscheinlichkeit.
2. Tracking des Minderungstatus
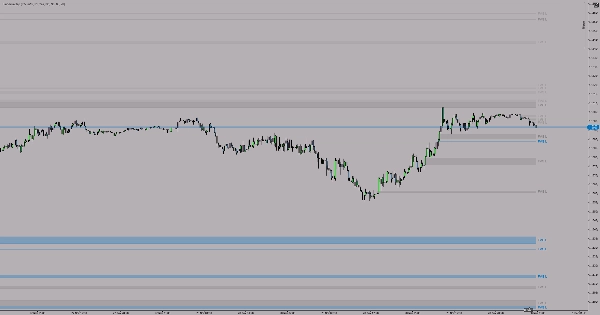
Die farbcodierte Anzeige zeigt sofort an, wenn ein FVG „berührt“ wurde. Dies ist eine kritische Information:
- Der erste Kontakt löst oft eine starke Reaktion aus
- Geminderte FVGs sind in der Regel schwächere Unterstützungs-/Widerstandszonen
3. Sauberer Chart, fokussiertes Trading
- Begrenzte Anzahl an FVGs (Standard: 20) pro Zeitrahmen
- Nur relevante, aktive Gaps sind sichtbar
Ein ideales Werkzeug für SMC/LIT-Trader, jene, die institutionelle Handelsmethoden verwenden, und Trader, die mit einem Verständnis der Preis-Liquiditäts-Dynamik handeln möchten.


![„[CB] Pivot Points Pro“-Logo](https://cdn.ctrader.com/image/webp/43463c82-67b0-4f10-a4ba-901bba091d81_32594)
