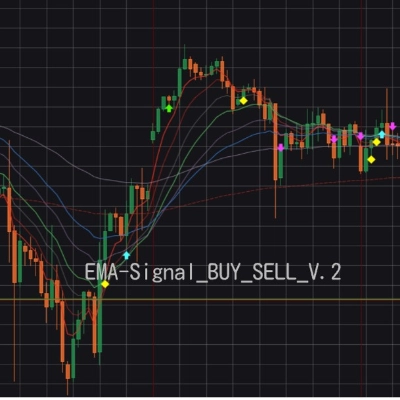
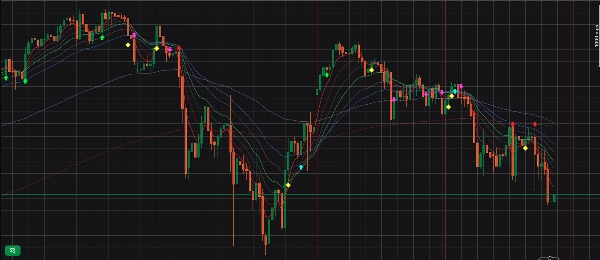
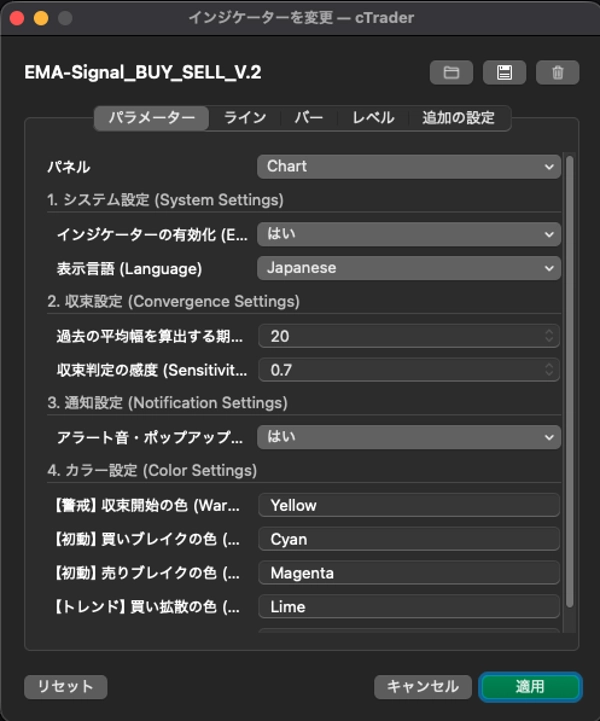
الوصف
[ العنوان ] EMA-Signal_BUY_SELL_V.2 (مُنبّه التقارب الديناميكي والانفجار)
[ الوصف ] مؤشر مخصص بمستوى احترافي مصمم لرصد تحركات الأسعار الانفجارية قبل حدوثها. مثالي للتداول اليومي المائل إلى السكالبينج على أصول شديدة التقلب مثل US500 وUS100 وJP225.
يراقب هذا المؤشر 6 متوسطات متحركة أُسية (5، 9، 14، 19، 28، 38) لقياس المسافة بينها بشكل ديناميكي. ينبهك بصريًا إلى مراحل السوق التي تتراوح من "التقارب" (تراكم الطاقة) إلى "الانفجار" (البداية المبكرة للاتجاه) و"توسع الترتيب المثالي" (تأكيد الاتجاه).
[ الميزات الجديدة في الإصدار 2 ]
- دعم ثنائي اللغة: التبديل بين واجهة المعلمات ورسائل التنبيه بين الإنجليزية واليابانية.
- ألوان قابلة للتخصيص بالكامل: تغيير لون جميع علامات الإشارة بسهولة لتتناسب مع موضوع الرسم البياني الخاص بك.
- مفتاح الإيقاف المؤقت: تمكين/تعطيل حسابات المؤشر والتنبيهات فورًا من المعلمات.
[ الإشارات واستراتيجيات التداول ] عند تفعيل التنبيه، تحقق من الرسم البياني ونفذ التداولات اليدوية بناءً على المراحل التالية:
1. ◆ علامة الماسة (تحذير: التقارب)
- المعنى: طاقة السوق تضغط (سوق نطاق).
- الاستراتيجية: لا تدخل. هذه هي إشارة الاستعداد والمراقبة لتحرك انفجاري قادم.
2. السهم الأول (الحركة الأولى: اختراق EMA 5)
- المعنى: المتوسط الأسي الأقرب EMA 5 اخترق تمامًا مجموعة المتوسطات الخمسة الأخرى.
- الاستراتيجية: هذه هي أول علامة على توليد اتجاه بعد التقارب. مثالي للدخول المبكر العدواني.
3. السهم الثاني (الاتجاه: توسع الترتيب المثالي)
- المعنى: جميع المتوسطات الأُسية مصطفة تمامًا وتتسع.
- الاستراتيجية: الاتجاه مؤكد بالكامل. هذا يوفر أعلى احتمال وأأمن نقطة دخول.
🔥 النمط الذهبي 🔥 الماسة (شحن الطاقة) > السهم الأول (الاختراق المبكر) > السهم الثاني (تأكيد الاتجاه). عندما تضيء الإشارات بهذا الترتيب بالضبط، فهذا يمثل الإعداد الأكثر ترقبًا وثباتًا.
[ كيفية الإعداد ]
- قم بتطبيق "EMA-Signal_BUY_SELL_V.2" على الرسم البياني الخاص بك (مثلاً، إطار زمني 15 دقيقة).
- (موصى به) أضف يدويًا 6 متوسطات متحركة أُسية قياسية (5، 9، 14، 19، 28، 38) إلى الرسم البياني لتأكيد بصري واضح للإشارات.
【 日本語 バージョン 】
[ タイトル ] EMA-Signal_BUY_SELL_V.2 (ダイナミック収束&ブレイクアウト通知)
[ 説明文 ] 爆発的なトレンドが発生する「初動」を的確に捉えるために開発された、プロ仕様のカスタムインジケーターです。US500、US100、JP225などのボラティリティが高い銘柄での、スキャルピング寄りのデイトレードに最適です。
6本のEMA(5, 9, 14, 19, 28, 38)の幅を監視し、相場のエネルギーが溜まる「収束」から、トレンドが発生する「初動ブレイク」、そして「パーフェクトオーダーの拡散」までを視覚的なマークとポップアップ・アラートでお知らせします。
[ V.2 の新機能 ]
- 日英言語切り替え: パラメーター画面とアラート通知を「日本語 / English」で自由に切り替え可能。
- カラーの完全カスタマイズ: 5種類のシグナルマークの色を、ご自身のチャート背景に合わせて自由に変更可能。
- 一時停止スイッチ: チャートから削除することなく、パラメーターからワンタッチで計算と通知を一時停止可能。
[ シグナルの意味とトレード戦術 ] アラートが鳴ったらチャートを確認し、以下の状況に合わせて判断を下します。
1. ◆ ダイヤマーク(【警戒】収束の開始)
- 意味: 相場のエネルギーが溜まり始めました(レンジ相場)。
- 戦術: ここでエントリーしてはいけません。次に価格が上下どちらかに爆発するのを待つ「準備・監視」の合図です。
2. 最初の矢印(【初動】EMA5のブレイクアウト)
- 意味: EMA5が、他の5本の束を完全にぶち抜きました。
- 戦術: 収束状態のあとにこれが出たら、トレンド発生の一番早い初動サインです。アグレッシブに攻める(打診買い/売り)タイミングです。
3. 2番目の矢印(【トレンド】パーフェクトオーダーの拡散)
- 意味: 全てのEMAが綺麗に並び、束が扇状に広がり始めました。
- 戦術: トレンドが本格的に確定したサインです。最も勝率が高く安全なエントリーポイントとなります。
🔥 最強の黄金パターン 🔥 黄色の◆(エネルギー充電) > 初動の矢印(ブレイク) > 拡散の矢印(トレンド確定) この順番でシグナルが点灯した時は、最も期待値の高い鉄板の形(セットアップ)となります。
[ チャートへの適用方法 ]
- 対象のチャート(15分足など)に「EMA-Signal_BUY_SELL_V.2」を適用します。
- (推奨)視覚的にもわかりやすくするために、標準のEMAを6本(5, 9, 14, 19, 28, 38)チャート上に手動で追加表示してご利用ください。
الملخص
Key signals include:
1. Diamond Mark indicating market convergence and preparation phase.
2. First Arrow signaling EMA 5 breakout as an early trend entry point.
3. Second Arrow showing perfect EMA alignment confirming a strong trend.
Traders use these signals sequentially for timing entries, especially on volatile assets like US500, US100, and JP225, with a recommended setup on 15-minute charts alongside manually added EMAs for visual confirmation. The indicator focuses on visualization and alerting of trend strength, breakouts, and reversals based on EMA dynamics.
تقييمات العملاء
5 | 100 % | |
4 | 0 % | |
3 | 0 % | |
2 | 0 % | |
1 | 0 % |












![شعار "[Stellar Strategies] Linear Regression Candles 1.1"](https://cdn.ctrader.com/image/webp/8b9cff9f-2431-46d2-b0ec-c7f55f4a4a6d_27918)