Description
Product Description: BullMoon Performance Panel
The BullMoon Performance Panel is a powerful analytical tool for cTrader, designed to help traders monitor their performance in real-time and visually reconstruct past trades directly on the chart.
1. Market Data and Conditions
The panel analyzes your account-related trading data and the historical price data of the selected symbol.
- It evaluates both closed and running trades to calculate key metrics such as net profit, drawdown, and win rate.
- The indicator scans your history to precisely locate entry and exit points.
2. Interpretation of Signals and Visual Elements
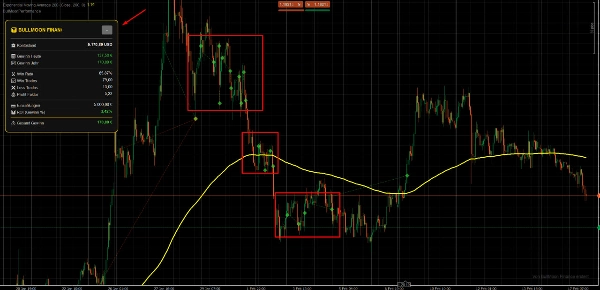
To make analysis as intuitive as possible, the tool uses clear visual markers directly on the chart:
- Symbols: Entries and exits are marked with specific symbols (e.g., arrows or dots), allowing you to see immediately where a position was opened and closed.
- Visual Lines: Lines connecting these symbols illustrate the duration of the trade, making profit or loss phases visually tangible.
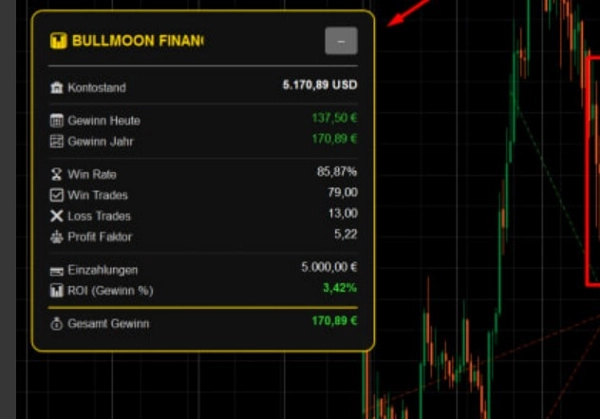
- Dashboard: A compact on-screen dashboard provides hard facts, including profit in USD, total lots traded, and the R-factor.
3. Key Settings and Parameters
You can customize the panel to fit your specific trading style:
- History Period: Define how many days of past trades should be displayed on the chart.
- Visuals: Colors for winning and losing trades, as well as the transparency of lines and symbols, are fully adjustable.
- Calculation Basis: Set fixed lot sizes or a percentage-based risk for the statistical output.
4. Typical Use Cases and Trading Scenarios
- Post-Trade Analysis: Review your trading day to ensure you followed your strategy correctly.
- Strategy Optimization: Visually identify if your Take Profit or Stop Loss levels are consistently set too tight or too wide.
- Live Monitoring: Keep track of your current daily performance without having to switch back and forth to the account history tab.
5. Target Audience (Account Size and Experience)
- Experience Level: Suitable for beginners looking to gain a better feel for their trades, as well as professionals who require a quick visual performance check.
- Account Size: Appropriate for any account size. It is especially valuable for traders running multiple strategies simultaneously who need to maintain a clear overview.
6. Important Limitations and Usage Notes
- Platform: Developed exclusively for cTrader.
- Data Availability: The display of historical trades depends on the data being available within your cTrader account history.
- Not a Signal Generator: Please note that this panel is an analytical tool and does not generate independent buy or sell signals.
Summary
The panel features a compact dashboard displaying key statistics including profit in USD, total lots traded, and the R-factor. Users can customize the display period for historical trades, adjust colors and transparency of visual elements, and set calculation parameters based on fixed lot sizes or percentage risk.
Typical use cases include post-trade analysis, strategy optimization by evaluating take profit and stop loss settings, and live monitoring of daily performance without switching views. The tool supports various markets and symbols such as Forex (EURUSD, GBPUSD, USDJPY), Indices (NAS100), Commodities (XAUUSD), Crypto (BTCUSD), and Stocks. It is suitable for traders of all experience levels and account sizes, especially those managing multiple strategies simultaneously. The panel is strictly an analytical tool and does not generate trade signals.
Customer reviews
5 | 100 % | |
4 | 0 % | |
3 | 0 % | |
2 | 0 % | |
1 | 0 % |