
الوصف
ما هو LTtradingBox؟
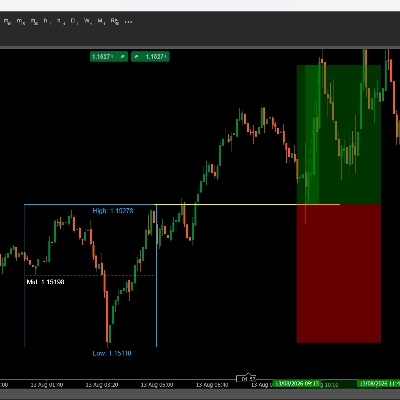
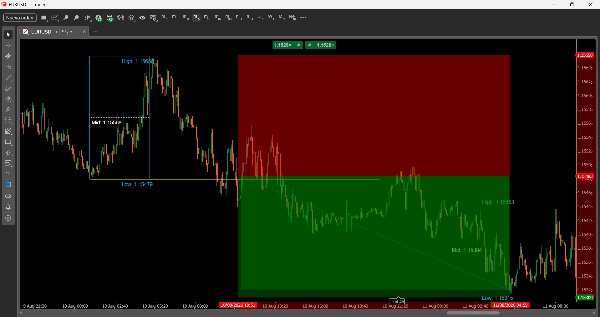
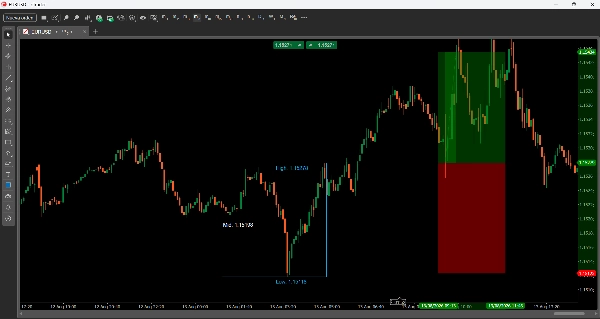
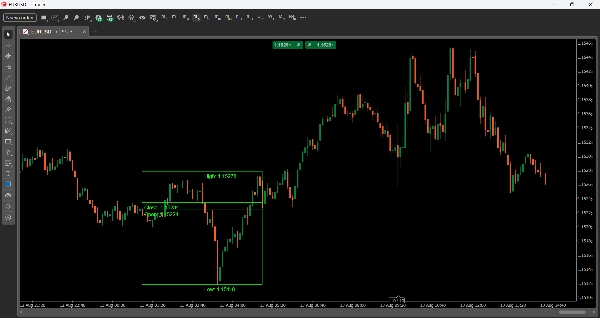
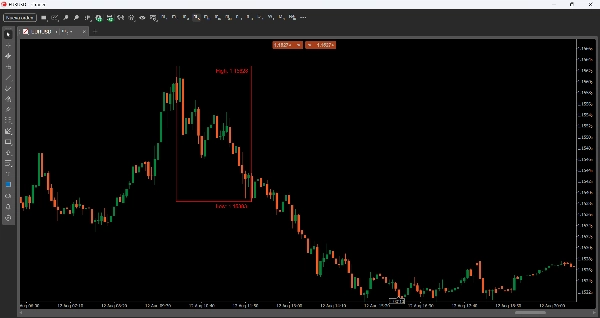
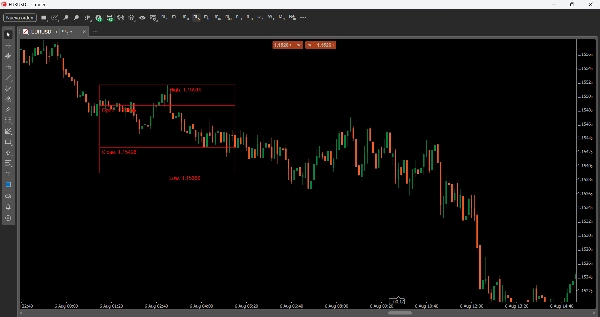
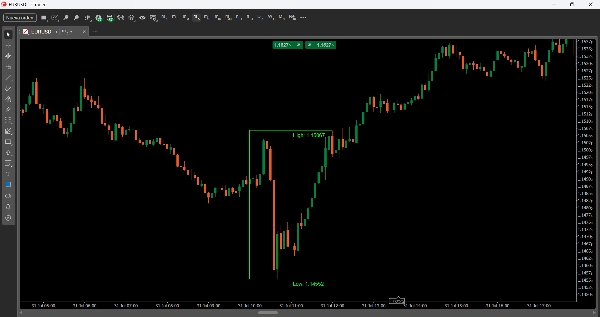
يقوم LTtradingBox بتحديد نطاق السعر بصريًا (الأعلى، الأدنى، الافتتاح، والإغلاق) لفترة زمنية تحددها — على سبيل المثال جلسة لندن أو نيويورك. يتغير لون الصندوق تلقائيًا بناءً على نتيجة تلك الجلسة: أخضر إذا أغلق صعوديًا، أحمر إذا أغلق هبوطيًا، رمادي إذا كان محايدًا (أو أي ألوان تختارها لكل حالة). كما يضيف خطوط مرجعية (سعر المنتصف، وقت المنتصف) وملء بصري اختياري، مما يساعدك على تحديد مناطق السيولة، نطاقات التراكم، والمستويات الرئيسية للتداول بنظرة سريعة.
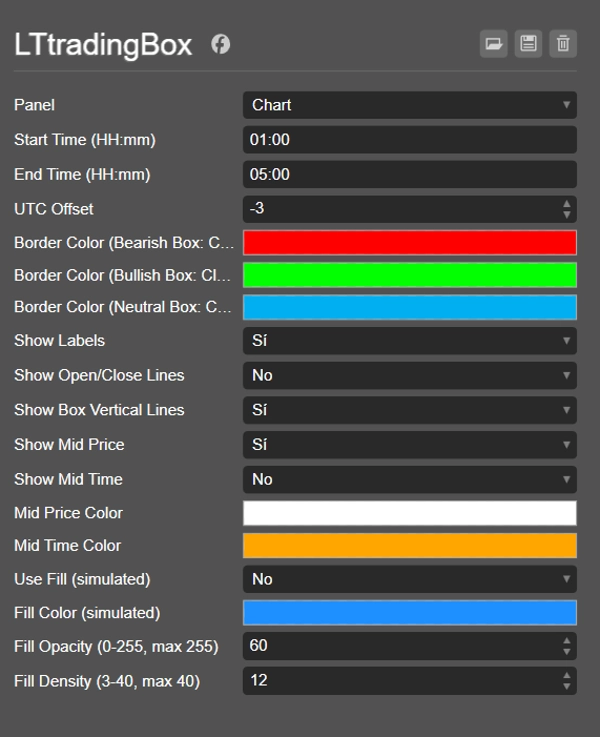
المعلمات
إعدادات الوقت
- وقت البدء (HH:mm) — وقت بدء الصندوق (صيغة 24 ساعة).
- وقت الانتهاء (HH:mm) — وقت انتهاء الصندوق.
- تعويض UTC — تعديل الوقت بحيث يتماشى الصندوق مع توقيتك المحلي أو الجلسة التي تريد تتبعها (مثل لندن، نيويورك، آسيا)، بغض النظر عن المنطقة الزمنية للوسيط الخاص بك.
الألوان
- لون الحدود (الصندوق الهبوطي: الإغلاق < الافتتاح) — لون الحدود عندما يغلق الصندوق هبوطيًا.
- لون الحدود (الصندوق الصعودي: الإغلاق > الافتتاح) — لون الحدود عندما يغلق الصندوق صعوديًا.
- لون الحدود (الصندوق المحايد: الإغلاق == الافتتاح) — لون الحدود عندما يكون الإغلاق مساويًا للفتح.
خيارات العرض
- عرض التسميات — يبدل عرض التسميات النصية التي تظهر القيم الأعلى، الأدنى، الافتتاح، والإغلاق.
- عرض خطوط الافتتاح/الإغلاق — يرسم خطوطًا أفقية تحدد سعر الافتتاح والإغلاق داخل الصندوق.
- عرض خطوط الصندوق الرأسية — يفعّل المستطيل الكامل (4 حدود)؛ إذا تم تعطيله، تظهر فقط خطوط الأعلى والأدنى.
- عرض سعر المنتصف — يرسم خطًا منقطًا عند نقطة المنتصف بين الأعلى والأدنى.
- عرض وقت المنتصف — يرسم خطًا عموديًا عند نقطة المنتصف الزمنية للصندوق.
- لون سعر المنتصف / لون وقت المنتصف — ألوان قابلة للتخصيص لتلك الخطوط.
الملء (الملء البصري)
- استخدام الملء (محاكاة) — يفعّل ملء محاكى داخل الصندوق (باستخدام خطوط رفيعة متراكبة).
- لون الملء (محاكاة) — لون الملء.
- شفافية الملء (0-255، الحد الأقصى 255) — مستوى شفافية الملء.
- كثافة الملء (3-40، الحد الأقصى 40) — عدد الخطوط المستخدمة لمحاكاة الملء (كلما زادت الكثافة = ملء أكثر صلابة).
أفكار التداول
- الاختراق وإعادة الاختبار: انتظر حتى يكسر السعر الأعلى أو الأدنى للصندوق، ثم يعود لإعادة اختبار ذلك المستوى كدعم/مقاومة قبل الدخول في اتجاه الاختراق.
- الانعكاس عند الأطراف: إذا لمس السعر الأعلى أو الأدنى للصندوق دون اختراق بقوة، فقد يشير ذلك إلى رفض وتحرك نحو الجانب المقابل من الصندوق.
- التحيز الاتجاهي حسب الجلسة: يعطي لون الصندوق تحيزًا سريعًا (صعودي/هبوطي/محايد) حول كيفية تحرك تلك الجلسة، مفيد لمزامنة الدخول في الجلسات اللاحقة.
- سعر المنتصف كمغناطيس: غالبًا ما يعمل نقطة المنتصف كمنطقة إعادة توازن — ابحث عن دخول عندما يعود السعر إلى المنتصف بعد حركة دافعة قوية.
- مقارنة الصناديق المتتالية: بما أن كل صندوق يومي محفوظ (عبر علامة التاريخ الخاصة به)، يمكنك مقارنة النطاق والتحيز لعدة جلسات متتالية لرصد الاتجاهات قصيرة الأجل.
الملخص
ملخص الذكاء الاصطناعي
LTtradingBox is a customizable trading indicator that visually highlights the price range—high, low, open, and close—within any user-defined time window, such as a specific trading session. The indicator draws a colored box representing this range, automatically changing its border color to green for bullish closes, red for bearish closes, or gray for neutral, with customizable color options. It includes reference lines for the midpoint price and midpoint time, which can be displayed as dotted or vertical lines, aiding in identifying liquidity zones, accumulation areas, and key support/resistance levels.
Users can configure start and end times, apply a UTC offset to align with local or session times, and toggle display options such as labels for price points, open/close lines, full box borders, and visual fills with adjustable color, opacity, and density. The indicator supports trading strategies including breakout and retest of box boundaries, reversal signals at extremes, session-based directional bias, and using the midpoint as a rebalancing zone. It also allows comparison of consecutive session boxes to detect short-term trends. LTtradingBox is designed to assist traders in quickly identifying key levels and market structure within chosen timeframes.
Users can configure start and end times, apply a UTC offset to align with local or session times, and toggle display options such as labels for price points, open/close lines, full box borders, and visual fills with adjustable color, opacity, and density. The indicator supports trading strategies including breakout and retest of box boundaries, reversal signals at extremes, session-based directional bias, and using the midpoint as a rebalancing zone. It also allows comparison of consecutive session boxes to detect short-term trends. LTtradingBox is designed to assist traders in quickly identifying key levels and market structure within chosen timeframes.
ملف تعريف المؤشر
فئة المؤشر
الدعم والمقاومة
نوع المخرجات
التصور
متطلبات البيانات
أعمدة السعر فقط
الإشارات المدعومة
الانقطاع
الانعكاس
كسر المستوى
لمس المستوى
تقييمات العملاء
0.0
التقييمات: 0
تقييمات العملاء
لا توجد تقييمات لهذا المنتج حتى الآن. هل جرَّبته بالفعل؟ كن أول من يخبر الآخرين!
مناقشة
الأسئلة الشائعة
Key Levels
Support & Resistance
يتم توفير المنتجات المتاحة من خلال cTrader Store، بما في ذلك روبوتات التداول والمؤشرات والإضافات، من قبل مطوري الطرف الثالث وإتاحتها لأغراض الوصول المعلوماتي والفني فقط. cTrader Store ليس وسيطًا ولا يقدم نصائح استثمارية أو توصيات شخصية أو أي ضمان للأداء المستقبلي.




![شعار "[Hamster-Coder] Moving Average MTF"](https://cdn.ctrader.com/image/webp/b11b98b1-194d-4b8e-b00e-d611826ad159_31226)













السعر
منذ 10/01/2025