
present
سجل واحصل على خصم 50 دولارًا على مشترياتك الأولى
Trading product for FractalMS by SeekXow مؤشر Key Levels MSS, image 1
FractalMS by SeekXow
مؤشر
الإصدار 1.0، Aug 2026
Windows, Mac
Trading product for FractalMS by SeekXow مؤشر Key Levels MSS, image 2
Trading product for FractalMS by SeekXow مؤشر Key Levels MSS, image 3
Trading product for FractalMS by SeekXow مؤشر Key Levels MSS, image 4
منذ 09/12/2025
8.14M
حجم التداول
16.34K
الربح بالبيب

الوصف

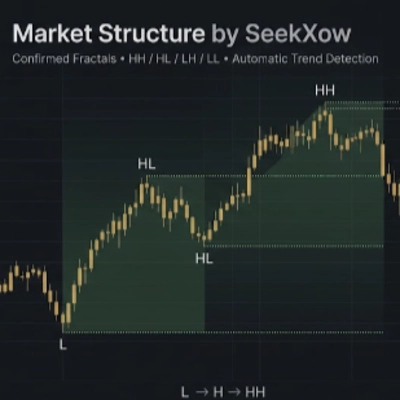
مؤشر حركة السعر مصمم لتحديد وتصور هيكل السوق باستخدام نقاط ارتكاز فراكتالية مؤكدة. يتتبع المؤشر قمم وقيعان التأرجح ويصنفها إلى:

  • HH — أعلى أعلى
  • HL — أدنى أعلى
  • LH — أعلى أدنى
  • LL — أدنى أدنى

يستخدم نقاط ارتكاز فراكتالية مؤكدة لتقليل الضوضاء وتجنب الاعتماد على تقلبات السعر غير المؤكدة. يتم ضغط نقاط الارتكاز المتتالية من نفس النوع بحيث يتم الاحتفاظ بالنقطة القصوى ذات الصلة قبل تقييم هيكل السوق.

الميزات الرئيسية

  • كشف تأرجح قائم على الفراكتال المؤكد
  • تصنيف تلقائي لـ HH / HL / LH / LL
  • كشف هيكل السوق الصاعد والهابط
  • تحديد حالة الاتجاه تلقائيًا
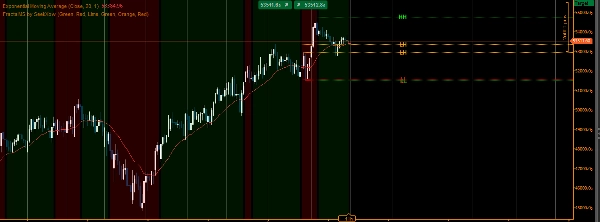
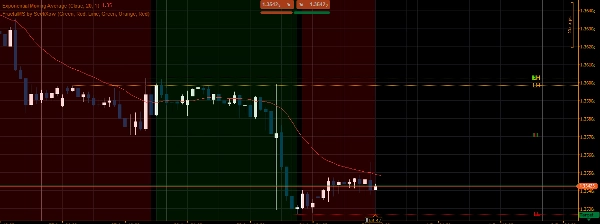
  • مستويات هيكل أفقية بصرية
  • تصور خلفية الاتجاه
  • يتكيف الهيكل مع تطور نقاط ارتكاز مؤكدة جديدة
  • مصمم لتحليل حركة السعر التقديري وهيكل السوق

كيف يعمل

يكتشف المؤشر أولاً قمم وقيعان التأرجح المؤكدة. ثم تتم معالجة هذه النقاط إلى تسلسل متناوب من القمم والقيعان. يُستخدم تسلسل النقاط الناتج لتحديد هيكل السوق الحالي والاتجاه. خلال الاتجاه الصاعد، يمكن للقمم الجديدة أن تؤسس قمم أعلى، بينما يصبح القاع التصحيحي ذي الصلة هو قاع أعلى. يتم تطبيق المنطق المعاكس خلال الاتجاه الهابط. يمكن أن يؤدي كسر المستوى الهيكلي ذي الصلة إلى تحفيز تغيير في الاتجاه المكتشف.

الاستخدام المقصود

يمكن استخدام المؤشر كطبقة هيكل سوق إلى جانب حركة السعر، الدعم/المقاومة، تحليل السيولة، أو أدوات فنية أخرى. وهو مناسب للمتداولين الذين يبحثون عن تمثيل بصري أنظف لهياكل التأرجح عبر أطر زمنية مختلفة.

ملاحظة: هذا المؤشر هو أداة تحليل فني ولا يقدم نصائح مالية أو يضمن نتائج التداول.

الملخص

ملخص الذكاء الاصطناعي
FractalMS by SeekXow is a price-action indicator that identifies and visualizes market structure using confirmed fractal pivots. It detects swing highs and lows and classifies them into four pivot types: Higher High (HH), Higher Low (HL), Lower High (LH), and Lower Low (LL). By relying on confirmed fractal pivots, the indicator reduces noise and avoids repainting, compressing consecutive pivots of the same type to retain relevant extremes before evaluating market structure.

Key features include automatic classification of pivot types, bullish and bearish market structure detection, trend-state identification, visual horizontal structure levels, and trend background visualization. The indicator continuously adapts as new confirmed pivots develop.

FractalMS works by detecting confirmed swing highs and lows, processing them into an alternating sequence to determine current market structure and trend. During uptrends, it identifies higher highs and higher lows; during downtrends, it identifies lower highs and lower lows. Breaking structural levels signals potential trend changes.

Designed for discretionary price-action and market-structure analysis, this tool supports traders seeking a clearer visual representation of swing structure across multiple timeframes. It complements other technical tools such as support/resistance and liquidity analysis.

ملف تعريف المؤشر
فئة المؤشر
هيكل السوق (SMC)
نوع المخرجات
التصور
متطلبات البيانات
أعمدة السعر فقط
الإشارات المدعومة
الانقطاع
قوة الاتجاه
كسر المستوى
الانعكاس
لمس المستوى

تقييمات العملاء

0.0
التقييمات: 0
تقييمات العملاء
لا توجد تقييمات لهذا المنتج حتى الآن. هل جرَّبته بالفعل؟ كن أول من يخبر الآخرين!

مناقشة

الأسئلة الشائعة

Key Levels
MSS
Market Structure
Support & Resistance
يتم توفير المنتجات المتاحة من خلال cTrader Store، بما في ذلك روبوتات التداول والمؤشرات والإضافات، من قبل مطوري الطرف الثالث وإتاحتها لأغراض الوصول المعلوماتي والفني فقط. cTrader Store ليس وسيطًا ولا يقدم نصائح استثمارية أو توصيات شخصية أو أي ضمان للأداء المستقبلي.

المزيد من هذا المؤلف

شعار "Tengoku V3 by SeekXow"
إحصائيات مباشرة
من 80$
cBot
Key Levels
Conservative
+5
XAUUSD market-structure cBot with dynamic risk, adaptive entries and automated trade management.
3.8
عامل الربح

قد يعجبك أيضًا

مؤشر
Breakout
FlexSR auto‑detects pivot highs/lows to plot dynamic support & resistance lines Features customizable styling and option
شعار "KANDIKA HEAT MAP"
الأعلى تقييمًا
4.6
(5)
$19
مؤشر
Color-Based Market Pressure & Volatility Visualizer The Kandika Heatmap Indicator
مؤشر
Prop
Forex
+12
Identify and trade breakouts with Consolidation Zones! Visualize price consolidation areas for trading opportunities.
مؤشر
ATR
Prop
+14
Optimize exits with Chandelier Exit! Visualize stop-loss points dynamically for improved trading precision and safety.
مؤشر
ATR
RSI
+8
Multi-timeframe market-state dashboard: Score (-100..+100) + UP/NEUT/DN per TF, with optional closed-candle arrows.
مؤشر
RSI
RSI on the main chart with 45/55 momentum levels, overbought/oversold levels, averaged RSI, and multi-timeframe support.
مؤشر
Forex
Version 3: Full control of session display including start and end times of all 3 sessions!
مؤشر
Prop
Forex
+13
Identifies market compression zones and explosive Breakout moments using mathematical modeling.
مؤشر
Signal
Breakout
+1
Bolliger Bands + Hamster-Coder™ Timeframe Decoupling
مؤشر
ATR
MACD
+15
MACD Advanced -- It combines the standard MACD logic with a rich set of visual tools
مؤشر
BOS
MSS
+5
Your entire ICT session map, structure engine, and key levels — No manual work. One indicator. Every session!
مؤشر
RSI
Stochastic
+2
Composite mean-reversion oscillator merging Z-Score, RSI & Bollinger %B into one clear overbought/oversold signal.
مؤشر
VWAP
Volume
+3
Don't trust static support and resistance levels, this indicator combines Fibonacci and VWAP in one powerful tool.
مؤشر
Forex
Crypto
+3
Consecutive Series Moves — Reveal the True Pulse of Price Action
مؤشر
Aggressive
Supertrend
+5
Stop trading with tunnel vision! 🚫 The Heat Map Dashboard is an institutional-grade visual trading assistant
مؤشر
Prop
VWAP
+5
VWAP is a powerful tool for intraday traders
مؤشر
Channel
Imbalance
+2
Adaptive volatility channel based on moving average and standard deviation (σ).
مؤشر
Crypto
Signal
+3
Candlestick Signal Finder: cTrader indicator that automatically detects and color-codes key Japanese candlestick pattern

السعر

منذ 09/12/2025
8.14M
حجم التداول
16.34K
الربح بالبيب















