Beschreibung
Candle Timer & Strength Panel DEMO für cTrader
DEMO-VERSION – 24 Stunden kostenlose Testphase!
Dies ist eine DEMO-Version des Candle Timer & Strength Panel Indikators für cTrader.
Sie können alle Funktionen 24 Stunden nach der Installation nutzen.
Nach Ablauf der Testphase wird der Indikator deaktiviert und zeigt eine Nachricht an.
Um die Vollversion zu erhalten, suchen Sie im cTrader Store nach "Candle Timer & Strength Panel".
Hauptmerkmale:
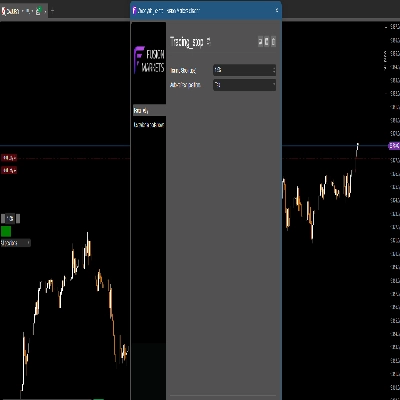
- Feste Panel-Überlagerung:
-
- Der Timer und die Stärke für jeden ausgewählten Zeitrahmen sind immer in einem einzigen, leicht lesbaren Panel oben in Ihrem Chart sichtbar.
- Wählen Sie die Panel-Position: links, zentriert oder rechts.
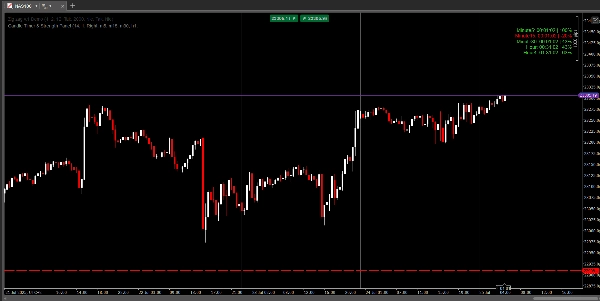
- Multi-Timeframe Candle Timer:
-
- Sehen Sie den Countdown bis zum nächsten Kerzenschluss in bis zu 5 ausgewählten Zeitrahmen.
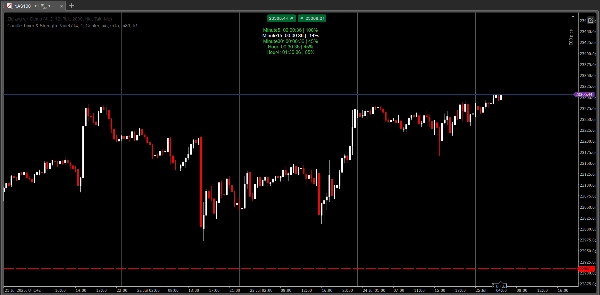
- Kerzenstärke in %:
-
- Sehen Sie sofort die Stärke der aktuellen Kerze (von -100% bis +100%) für jeden Zeitrahmen, basierend darauf, wo der Schlusskurs relativ zur Kerzenreichweite liegt.
- Dynamische Farbgebung: grün für stark bullisch, rot für stark bärisch, weiß für neutral.
- Anpassbare Anzeige:
-
- Stellen Sie Schriftgröße, vertikalen Abstand und Panel-Position ein.
- Wählen Sie Ihre bevorzugten Zeitrahmen (M1, M5, M15, M30, H1, H4 usw.).
- H4 Startstunde-Parameter für Broker mit nicht standardmäßigen H4-Kerzen.
- Perfekt für:
-
- Scalper und Daytrader, die präzises Kerzen-Timing und Momentum auf einen Blick benötigen.
- Multi-Timeframe-Trader, die ein sauberes, immer sichtbares Dashboard wünschen.
- Jeder, der seine Ein- und Ausstiegszeitpunkte sowie Kerzenlesefähigkeiten verbessern möchte.
Worin unterscheidet sich diese Version vom Standard Candle Timer & Strength?
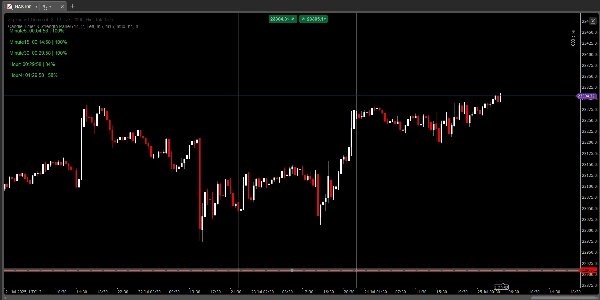
- Panel-Version:
-
- Alle Timer und Stärken werden in einem festen Panel oben im Chart angezeigt (nicht neben den Kerzen).
- Das Panel bewegt sich nicht und verschwindet nicht beim Zoomen oder Scrollen – es ist immer am gleichen Ort.
- Leichter zu lesen und professioneller für schnelle Entscheidungen und Multi-Timeframe-Analysen.
- Standard-Version:
-
- Timer und Stärken werden neben der letzten Kerze im Chart angezeigt und können sich beim Zoomen oder Scrollen mit der Kursbewegung verschieben oder überlappen.
Parameter:
- Vertikaler Abstand (Zeilen)
- Horizontale Panel-Position (links, zentriert, rechts)
- Zeitfenster 1–5 (benutzerdefiniert)
- H4 Startstunde (für Broker mit nicht standardmäßigen H4-Kerzen)
Warum Candle Timer & Strength Panel wählen?
- Sehen Sie immer die wichtigsten Timing- und Momentum-Daten – egal wie Sie zoomen oder scrollen.
- Perfekt für Multi-Timeframe- und schnelllebigen Handel.
- Sauberes, modernes und professionelles Erscheinungsbild.
- Einfach zu bedienen, vollständig anpassbar und leichtgewichtig.
Probieren Sie Candle Timer & Strength Panel aus und heben Sie Ihren Multi-Timeframe-Handel auf die nächste Stufe!
Sehen Sie alle meine Indikatoren und Bots:
https://ctrader.com/pl?search=kobud.222&u=kobud.222
http://www.youtube.com/@Robi22-22
📩 Fragen? Vorschläge? Rabatt?
Kontakt verfügbar in meinem Profil: Robikobud