ADX Indicator_noSourceCode
Wskaźnik
Wersja 1.0, Sep 2025
Windows, Mac
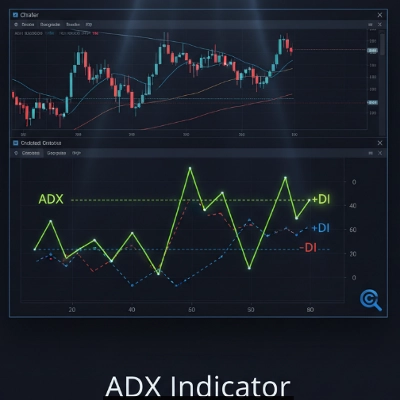
Zidentyfikuj siłę trendu z absolutną precyzją na cTrader
Masz dość handlu pod prąd trendu? Przedstawiamy ADX Indicator Pro, ostateczne narzędzie do odczytywania siły i kierunku rynku, stworzone specjalnie dla Twojej platformy cTrader.
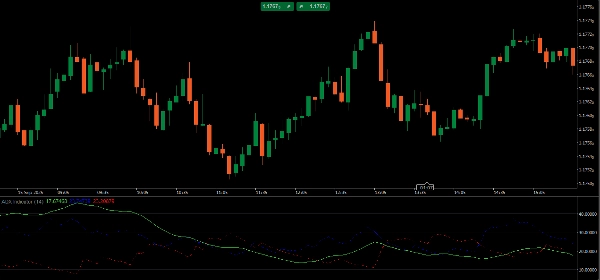
Ten wskaźnik to nie tylko kolejna linia na Twoim wykresie. To Twój kompas rynkowy, z zoptymalizowanym obliczaniem i czystym, przejrzystym designem, dzięki czemu masz potrzebne informacje dokładnie wtedy, gdy ich potrzebujesz.
Dzięki naszemu wskaźnikowi ADX będziesz:
- Rozumieć trend: Natychmiast dowiesz się, czy rynek ma siłę na ruch w górę lub w dół.
- Unikać pułapek: Przestań handlować na rynkach bocznych i tracić czas oraz pieniądze. ADX pokaże Ci, kiedy trend jest słaby.
- Handlować z pewnością: Dzięki linii ADX, +DI i -DI otrzymujesz pełną wizualizację, która pozwala podejmować bezpieczniejsze i mądrzejsze decyzje.
Gotowy do użycia, bezbłędny i z designem skupionym na Twojej wydajności. Podnieś swoją analizę rynku i przejmij kontrolę nad swoimi transakcjami.
Profil wskaźnika
0.0
Opinie: 0
Opinie klientów
Ten produkt nie ma jeszcze opinii. Wypróbowałeś(-aś) go już? Bądź pierwszy(-a) i powiedz o tym innym!
Prop
Forex
Indices
Commodities
Crypto
Stocks
Produkty dostępne za pośrednictwem cTrader Store, w tym boty handlowe, wskaźniki i wtyczki, dostarczane są przez deweloperów zewnętrznych i udostępniane wyłącznie w celach informacyjnych oraz w celu zapewnienia dostępu technicznego. cTrader Store nie jest brokerem i nie zapewnia doradztwa inwestycyjnego, nie udziela spersonalizowanych rekomendacji ani nie gwarantuje przyszłych wyników.


Od 05/02/2025
30
Sprzedaż