Beschreibung
Der Trendlines Oscillator hilft Händlern, Trends und Momentum basierend auf den normalisierten Abständen zwischen dem aktuellen Preis und den zuletzt erkannten bullischen und bärischen Trendlinien zu identifizieren.
Der Indikator verfügt über bullisches und bärisches Momentum, eine Signallinie mit Kreuzungen und mehrere Glättungsoptionen.
ANWENDUNG
Der Trendlines Oscillator funktioniert systematisch durch:
- Identifikation von Pivot-Hochs und -Tiefs.
- Verbinden der Pivots zur Bildung von bullischen (Unterstützungs-) und bärischen (Widerstands-) Trendlinien.
- Messung des Abstands (Delta) zwischen dem aktuellen Preis und diesen Trendlinien.
- Normalisierung dieser Abstände zwischen 0 und 100 zur Erstellung von Momentumwerten.
- Glättung der Werte für klarere Signale.
- Erzeugung von bullischen und bärischen Signalen, wenn das Momentum die Signallinie kreuzt.
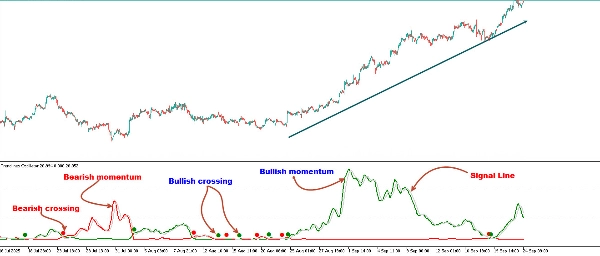
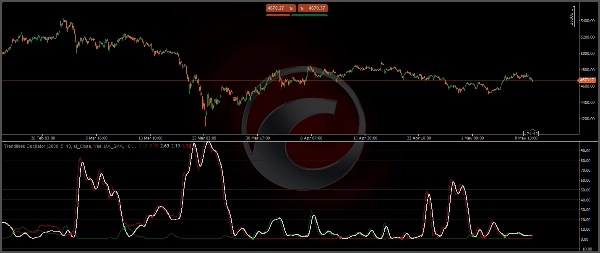
Der Oszillator zeigt drei Hauptlinien an:
Bullische Momentum-Linie (Grün): Misst die Stärke der Käufer, indem berechnet wird, wie weit der Preis von den jüngsten bullischen Unterstützungs-Trendlinien entfernt ist.
Bärische Momentum-Linie (Rot): Misst die Stärke der Verkäufer, indem berechnet wird, wie weit der Preis von den jüngsten bärischen Widerstands-Trendlinien entfernt ist.
Signallinie (Grau): Bietet Kreuzungen mit den Momentum-Linien, um potenzielle Handelsmöglichkeiten hervorzuheben.
Als allgemeine Regel gilt: Wenn die bullische Momentum-Linie über der bärischen Momentum-Linie liegt, zeigt dies Käuferstärke an. Das bedeutet, dass die aktuellen Preise weiter von den Unterstützungs-Trendlinien entfernt sind als von den Widerstands-Trendlinien. Das Gegenteil gilt für Verkäuferstärke.
Um das bullische Momentum zu berechnen, identifiziert das Tool zunächst bullische Trendlinien, die als Unterstützung unter dem Preis fungieren. Dann misst es das Delta zwischen dem Preis und diesen Trendlinien und normalisiert die Messung in die angezeigten Momentumwerte.
Der gleiche Prozess wird für das bärische Momentum verwendet, jedoch mit bärischen Trendlinien, die als Widerstand über dem Preis fungieren.
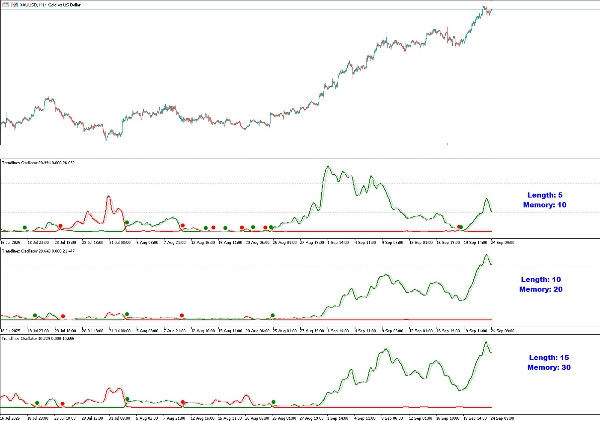
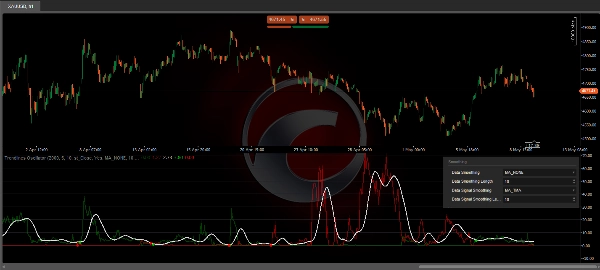
Länge & Speicher
- Länge: Bestimmt die Größe der Marktstruktur, die zur Erkennung von Trendlinien verwendet wird. Größere Werte erfassen breitere Trends, während kleinere Werte das Tool empfindlicher für kurzfristige Bewegungen machen.
- Speicher: Steuert, wie viele Trendlinien in die Berechnungen einbezogen werden. Höhere Speicherwerte glätten Signale für die Langzeitanalyse, während kleinere Speicherwerte schnellere Reaktionen ermöglichen.
Die Änderung der Werte für Länge und Speicher bewirkt, dass das Tool unterschiedliche Momentumwerte anzeigt.
Händler können die Länge anpassen, um größere Trendlinien zu erkennen, und den Speicher einstellen, um anzugeben, wie viele Trendlinien das Tool berücksichtigen soll.
Wie das obige Diagramm zeigt, machen kleinere Werte das Tool reaktionsschneller, während größere Werte nützlich sind, um größere Trends zu erkennen.
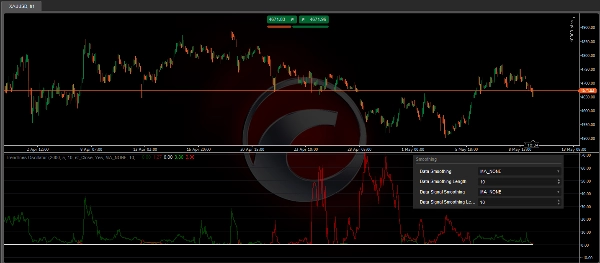
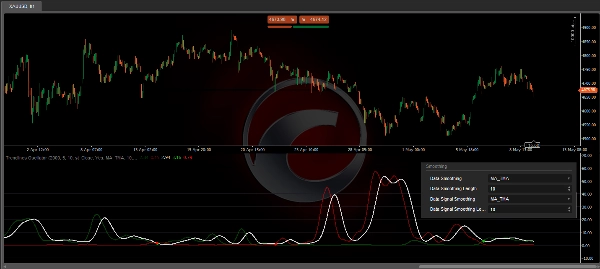
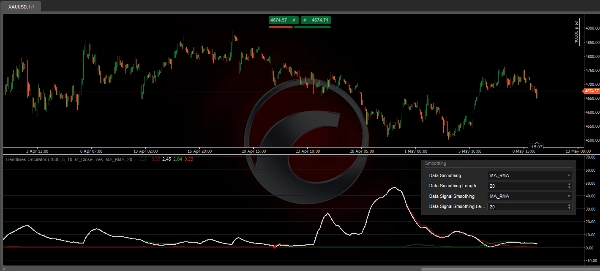
Glättung
- Daten-Glättung: Wendet eine Glättung auf die rohen Momentumwerte an.
- Signal-Glättung: Glättet die Signallinie selbst für klarere Kreuzungspunkte.
Standardmäßig werden die Daten durch SMA geglättet, und das Signal verwendet einen dreieckigen gleitenden Durchschnitt mit einer Länge von 10. Händler können sowohl die Daten als auch die Signallinie glätten.
Händler können verschiedene Methoden wählen oder keine. Einige Beispiele sind auf den angehängten Bildern gezeigt.
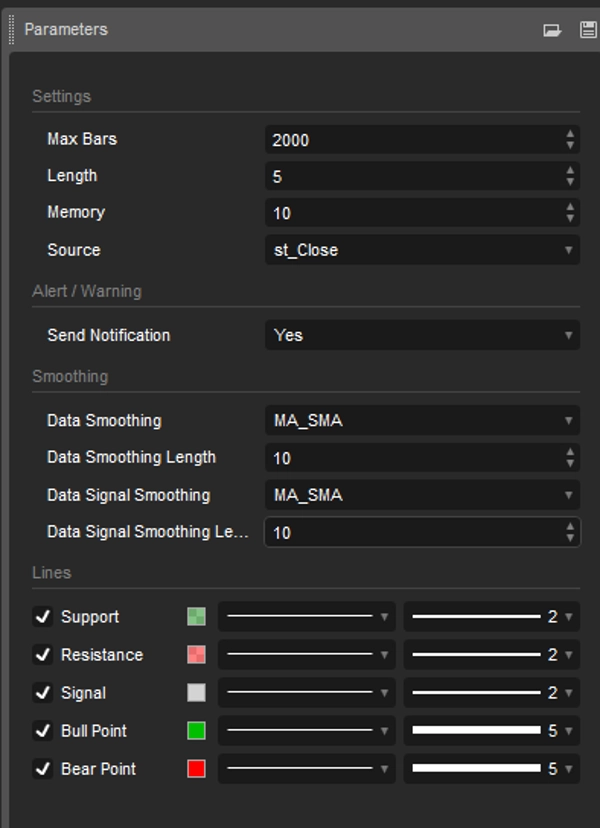
EINSTELLUNGEN
- Länge: Die Größe der Marktstruktur, die zur Trendlinienerkennung verwendet wird.
- Speicher: Die Anzahl der in den Berechnungen verwendeten Trendlinien.
- Quelle: Die Quelle für die Berechnungen sind standardmäßig Schlusskurse.
- Daten-Glättung: Wählen Sie die Glättungsmethode und -länge
- Signal-Glättung: Wählen Sie die Glättungsmethode und -länge
- Alarm: Alarm/Benachrichtigung bei bullischem/bärischem Kreuz
- Stile: Farbe, Stil, Breite der Unterstützungs-/Widerstands-/Signallinien anpassen
Der Trendlines Oscillator Handelsindikator ist ideal für Händler, die:
- Eine trendlinienbasierte Sicht auf das Momentum wünschen, anstatt sich ausschließlich auf gleitende Durchschnitte oder RSI zu verlassen.
- Klare visuelle Kreuzungen zur Signalisierung potenzieller Ein- und Ausstiege.
- Anpassbare Glättung zur Anpassung an verschiedene Handelsstile.
- Ein Tool, das die Dominanz von Käufern vs. Verkäufern in Echtzeit hervorhebt.
- Durch die Kombination von struktureller Marktanalyse mit Momentum-Berechnungen bietet dieses Tool einen einzigartigen Vorteil bei der Erkennung sowohl von Trendfortsetzungen als auch von Umkehrmöglichkeiten.
Zusammenfassung
Users can customize the indicator’s sensitivity and responsiveness by adjusting the Length (market structure size for trendline detection) and Memory (number of trendlines considered). The tool also offers data and signal smoothing options using various methods, including SMA and triangular moving averages, to provide clearer signals. The Trendlines Oscillator supports alerts for bullish and bearish crossovers and allows customization of line styles and colors. It provides a structural market analysis combined with momentum calculations to help traders assess buyer versus seller dominance and identify trend continuation or reversal opportunities.


