


Beschreibung
MARCs Market Overview Lite XAUUSD ist ein kostenloser, eingeschränkter Marktübersichtsindikator für cTrader.
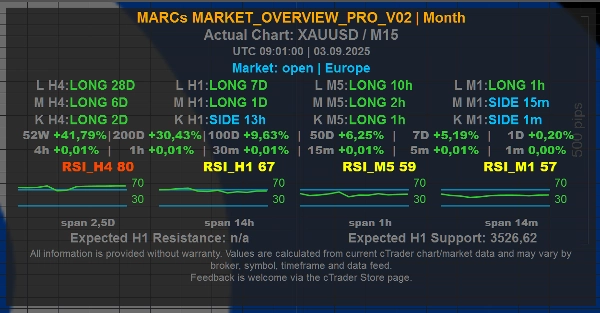
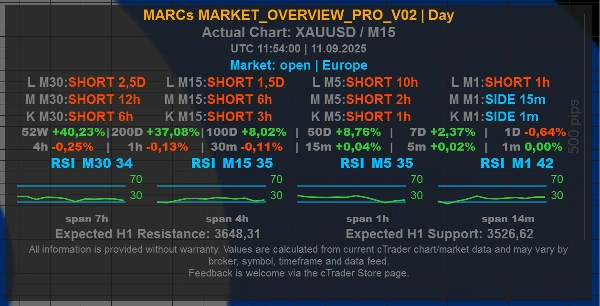
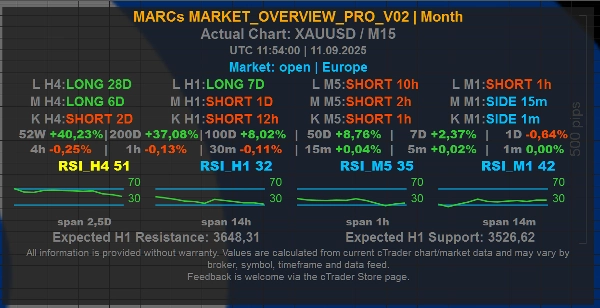
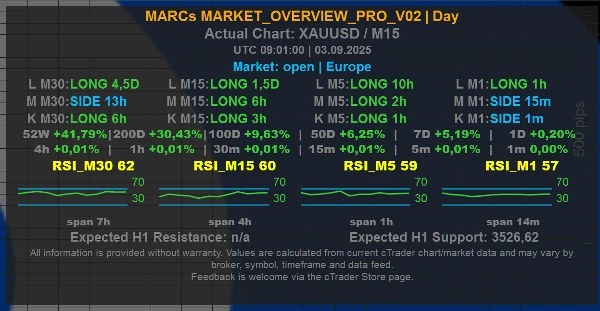
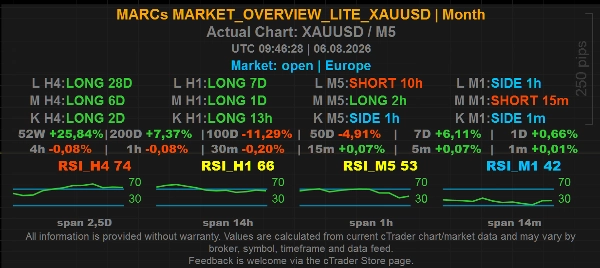
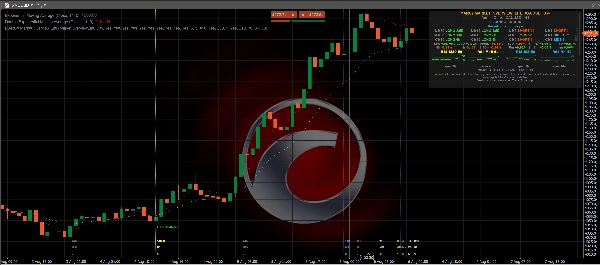
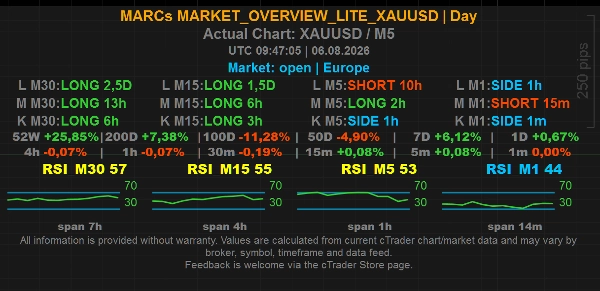
Er zeigt ein kompaktes Dashboard direkt im Chart für XAUUSD / Gold-Charts mit Multi-Timeframe-Trendkontext, RSI-Werten, Markt-/Sitzungsinformationen, optionalen Chart-Level-Werten und einem vereinfachten Satz von Anzeige-Steuerelementen.
Diese Lite-Version ist als fokussiertes XAUUSD-Übersichtstool konzipiert. Sie behält den Kern-Panel-Workflow von MARCs Market Overview bei, verwendet jedoch feste interne Einstellungen und eine begrenzte Presetauswahl.
Hauptmerkmale:
- Kostenlose Lite-Version für XAUUSD-Charts
- Kompaktes Marktübersichts-Panel direkt im Chart
- Multi-Timeframe-Trendzeilen für kurzen, mittleren und langen Marktkontext
- RSI-Werte und Mini-RSI-Historie über feste interne Zeitrahmen
- Markt-/Sitzungslinie mit UTC-Zeit
- Tages- und Monats-Zeithorizont-Presets
- Optionale Marktlinie
- Optionale H1-Chart-Level-Werte, die direkt im Panel angezeigt werden
- Optionale vereinfachte H1-Level-Linien im Chart
- Optionale Linienbeschriftungen, Level-Ursprungsmarkierungen und Rückblickmarkierungen
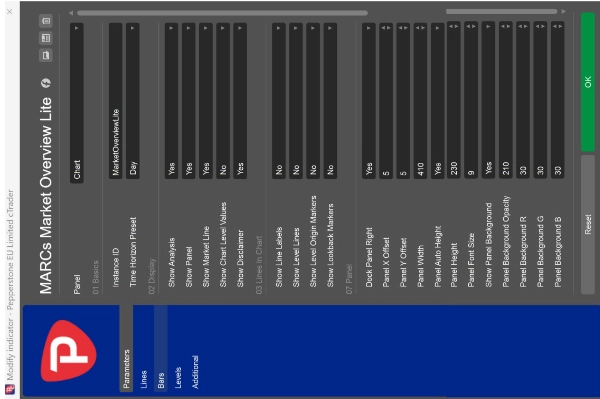
- Vollständig anpassbare Panel-Position, Breite, Höhe, Schriftgröße und Hintergrunddarstellung
Einschränkungen der Lite-Version:
- Funktioniert nur auf XAUUSD-Charts
- Zeithorizont-Preset ist auf Tag und Monat begrenzt
- Trendzeilen verwenden feste interne Zeitrahmen- und Kerzeneinstellungen
- RSI-Anzeige verwendet feste interne Einstellungen
- Zeit-Anzeige verwendet feste interne Einstellungen
- Chart-Level-Werte sind auf H1 beschränkt
- Chart-Level-Linien sind als vereinfachte Ein/Aus-Option verfügbar und verwenden feste H1-Level
- Einige erweiterte Anpassungsoptionen der Pro-Version sind nicht enthalten
Wenn der Indikator an ein anderes Symbol angehängt wird, zeigt das Panel eine deutliche XAUUSD-only-Hinweis anstelle der Übersichtswerte an.
Level-Linien und Chart-Level-Werte:
Die optionale Einstellung "Level-Linien anzeigen" kann berechnete H1-Chart-Referenzlevel anzeigen. In der Lite-Version ist dies auf eine Ein/Aus-Option vereinfacht. Wenn aktiviert, zeigt der Indikator den nächstgelegenen berechneten Widerstand über dem aktuellen Preis und die nächstgelegene berechnete Unterstützung unter dem aktuellen Preis an.
Die optionale Einstellung "Chart-Level-Werte anzeigen" kann dieselben nächstgelegenen H1-Widerstands-/Unterstützungsreferenzwerte direkt im Panel anzeigen, ohne Linien im Chart zu zeichnen. Die Panel-Linie ist beispielsweise mit "Chart Levels H1 | R ... | S ..." beschriftet, um klarzustellen, dass die Werte sich auf Chart-Level-Referenzen beziehen.
Wie Level-Linien berechnet werden:
Die Level werden aus vergangenen Swing-Hochs und Swing-Tiefs im ausgewählten internen Zeitrahmen abgeleitet. Nahegelegene Swing-Punkte werden zu Level-Clustern gruppiert, und nur Bereiche mit genügend wiederholten Berührungen werden angezeigt. Dies macht die Linien zu visuellen Markt-Kontextmarkern basierend auf verfügbarer Chart-Historie.
Was Level-Linien nicht bedeuten:
Level-Linien sind keine Kauf- oder Verkaufssignale, keine Stop-Loss-Empfehlungen, keine Take-Profit-Empfehlungen oder Anlageberatung. Sie sagen nicht voraus, dass der Preis an einem bestimmten Level umkehrt, ausbricht oder reagiert.
Über die Pro-Version:
MARCs Market Overview Pro bietet breitere Symbolnutzung, mehr Zeithorizont-Presets und detailliertere Anpassungsoptionen. Die Lite XAUUSD-Version ist eine kostenlose, fokussierte Version für Trader, die ein einfacheres Gold/XAUUSD-Marktübersichts-Panel wünschen.
Wichtig:
MARCs Market Overview Lite XAUUSD ist ein reines Analyse-Marktübersichtstool. Es führt keine Trades aus, verwaltet keine Positionen, gibt keine Anlageberatung und garantiert keine Handelsergebnisse.
Alle Werte hängen von den verfügbaren cTrader-Chartdaten, dem Broker-Symbolfeed, dem Zeitrahmen und der Markthistorie ab. Werte können zwischen Brokern, Symbolen und Datenfeeds variieren.
Trading beinhaltet Risiken. Vergangene Leistungen garantieren keine zukünftigen Ergebnisse.
TRANSPARENZHINWEIS
Dieser Indikator wurde mit Unterstützung KI-basierter Werkzeuge entwickelt.
Zusammenfassung
Level lines are calculated from past swing highs and lows on the H1 timeframe, highlighting key resistance and support clusters based on repeated price touches. These lines serve as visual market context markers but do not constitute trading signals or advice.
The panel’s position, size, font, and background appearance are fully adjustable. The Lite edition uses fixed internal settings and limited presets, restricting its use to XAUUSD charts only. It does not place trades or provide investment recommendations. This tool relies on available chart data and broker feeds, which may vary.
This edition offers a streamlined overview for Gold traders, with broader symbol support and customization available in the Pro version.
Diskussion
Kundenbewertungen
5 | 0 % | |
4 | 100 % | |
3 | 0 % | |
2 | 0 % | |
1 | 0 % |
Häufig gestellte Fragen (FAQ)


















Preis