Descrição
Quais dados de mercado ele analisa
O London Open Signal carrega anos do histórico intradiário do símbolo anexado diretamente do seu corretor (resolução M15 ou H1, sua escolha) e reconstrói cada dia de negociação passado em duas janelas: um intervalo completo de "dia" (hora de início/fim configurável) e a própria sessão de Londres (hora de abertura/fechamento configurável, no horário do servidor do corretor). Para cada sessão histórica, ele simula duas negociações hipotéticas — uma longa e uma curta — usando um stop e alvo fixos, saindo no fechamento da sessão se nenhum deles for atingido, líquido de uma margem para spread e custos. Em seguida, testa cinco ideias simples contra esses resultados para ver qual, se alguma, realmente previu o resultado: a sequência atual de vitórias/derrotas durante a noite, o dia da semana, onde o preço de abertura da sessão está dentro do intervalo do dia anterior, o gap em relação ao fechamento do dia anterior, e se o intervalo do dia anterior foi incomumente amplo ou estreito.
Como interpretar os sinais e elementos visuais
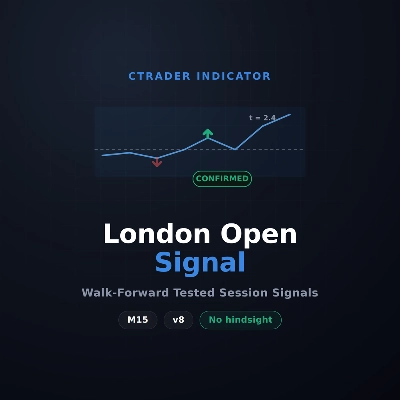
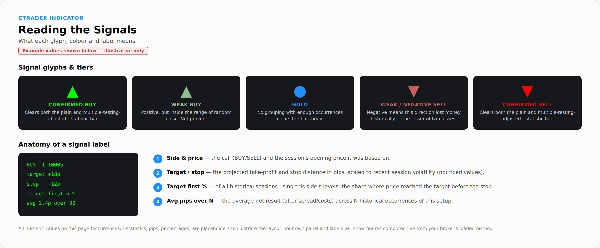
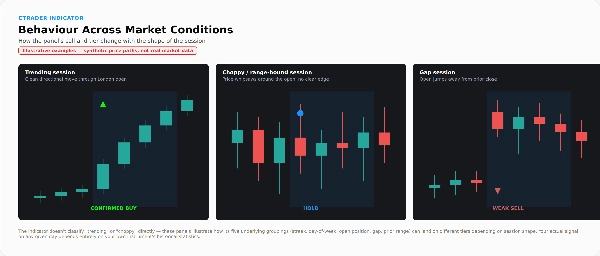
Uma seta verde para cima marca uma chamada de Compra na abertura de Londres daquele dia; uma seta vermelha para baixo marca Venda; um ponto azul marca Manter (nenhuma vantagem defensável encontrada). Essas setas históricas são calculadas de forma walk-forward — cada uma usa apenas os dados que teriam estado disponíveis antes daquele dia, nunca o resultado do próprio dia.
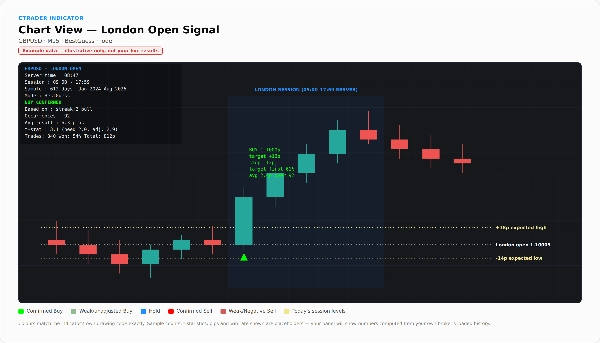
O painel no gráfico (canto superior esquerdo) mostra a chamada de hoje e um rótulo de nível: CONFIRMADO, CONFIRMADO (não ajustado), FRACO ou NEGATIVO. Isso indica o quanto confiar na seta — FRACO significa que a vantagem aparente está dentro do intervalo de ruído aleatório, e NEGATIVO significa que essa direção realmente perdeu dinheiro historicamente e a seta é apenas o menor de dois prejuízos. O painel também mostra em qual agrupamento a chamada se baseia, quantas vezes ocorreu, o resultado médio, a estatística t contra os limiares simples e ajustados para múltiplos testes, e — mais importante — um placar walk-forward em andamento: quantas negociações a ferramenta realmente teria feito, taxa de vitória, pips totais, pips por negociação e pior drawdown. Se esse total acumulado estiver estável ou negativo, o painel informa isso diretamente.
Três sobreposições opcionais adicionam detalhes: uma tabela completa de resultados (todos os agrupamentos testados, com tamanho da amostra e estatística t para ambas as direções), um "laboratório de stop/target" que mostra como a taxa de vitória muda puramente de acordo com onde você coloca o stop e o alvo — para destacar que uma alta taxa de vitória não é o mesmo que uma vantagem real — e uma caixa de níveis da sessão mostrando o tamanho típico do movimento para cima, para baixo e o intervalo total da sessão de Londres nos percentis mediano/75º/90º. Linhas pontilhadas na sessão de hoje marcam a abertura e o esperado máximo/mínimo ajustado pela volatilidade.
Configurações e parâmetros principais
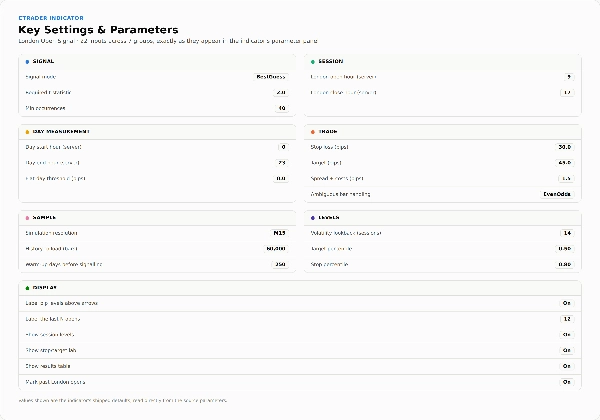
- Sinal: Modo (Somente Confirmado vs Melhor Palpite), estatística t requerida, ocorrências mínimas antes que um agrupamento conte
- Sessão: Hora de abertura de Londres, hora de fechamento de Londres (horário do servidor do corretor)
- Medição do dia: Hora de início/fim do dia, limite para dia estável (pips)
- Negociação: Stop loss (pips), Alvo (pips), margem para spread/custos (pips), tratamento de barra ambígua (Pessimista / Probabilidade igual / Otimista, para barras que tocam ambos stop e alvo)
- Amostra: Resolução da simulação (H1/M15), histórico a carregar (barras), dias de aquecimento antes da ferramenta começar a sinalizar
- Níveis: Retrospectiva de volatilidade (sessões), percentil do alvo, percentil do stop
- Exibição: Rotular setas / contar rótulos, mostrar níveis da sessão, mostrar laboratório stop-target, mostrar tabela de resultados, marcar aberturas passadas de Londres
Casos típicos de uso e cenários de negociação
Verificar o painel antes da abertura de Londres para a chamada atual, seu nível e o intervalo esperado da sessão para o dia. Pesquisar se algum padrão simples e interpretável se manteve estatisticamente para um par dado ao longo de sua própria história — e ver honestamente se esse padrão resiste à correção por ter testado várias ideias ao mesmo tempo. Usar as projeções de níveis da sessão (máximo/mínimo esperado) para planejar alvos ou stops independentemente da chamada de compra/venda em si. Não é projetado para execução automatizada sem supervisão — é um indicador, não um cBot, e nunca realiza uma negociação por conta própria.
Para quem isso é mais adequado
Traders que querem ver o histórico real verificado walk-forward por trás de um sinal em vez de aceitar uma afirmação pela fé, e que se sentem confortáveis lendo uma estatística t e um número de drawdown junto com uma seta. Traders discricionários da sessão de Londres que valorizam o contexto do intervalo da sessão mesmo quando escolhem ignorar a chamada de compra/venda. Não é construído deliberadamente para alguém que procura um sistema plug-and-play "basta seguir a seta" — a ferramenta avalia seus próprios sinais e dirá claramente quando os números não suportam negociá-los.
Limitações importantes e notas de uso
- O desempenho é calculado ao vivo a partir do histórico do corretor que está realmente carregado quando o indicador roda — não é um arquivo fixo de backtest pré-gerado, então os resultados podem variar por corretor/conta e precisarão de histórico suficiente carregado (aumente "Histórico a carregar" se o painel reportar dados insuficientes).
- O ajuste para múltiplos testes é uma heurística, não uma garantia — um limiar ajustado reduz, mas não elimina, a chance de um resultado parecer significativo apenas por sorte.
- As cinco ideias testadas são classificadores simples de fator único, verificados independentemente em vez de combinados — uma escolha deliberada para manter a ferramenta interpretável e evitar aumentar ainda mais o risco de overfitting.
- No modo Melhor Palpite, o indicador sempre mostra uma direção, incluindo chamadas de nível NEGATIVO — sempre leia o rótulo do nível, não apenas a seta.
- Preenchimentos simulados de stop/target usam uma suposição simplificada para barras que tocam ambos os níveis na mesma vela; a execução real pode ser diferente.
- Baseado puramente em preço/estatísticas — sem notícias, fundamentos ou entrada cruzada de ativos.
- Apenas visual e analítico; não realiza negociações.
Resumo
The indicator tests five simple, independent factors—overnight streak, day of the week, opening price position within the previous day’s range, gap size, and previous day’s range width—to identify statistically significant edges. Signals are displayed as arrows on the chart: green for Buy, red for Sell, and blue for Hold, with a tier label (CONFIRMED, WEAK, NEGATIVE) indicating the confidence level based on walk-forward testing.
A panel shows detailed statistics including win rate, total pips, t-statistics, and drawdown, updated live from broker data. Optional overlays provide a full results table, stop/target sensitivity analysis, and session-level range projections. The tool is purely analytical and visual; it does not execute trades and is intended for traders comfortable interpreting statistical metrics alongside signals.