
ACTO-v1
Wskaźnik
Wersja 1.0, Mar 2025
Windows, Mac
4.5
Opinie: 2
Opis
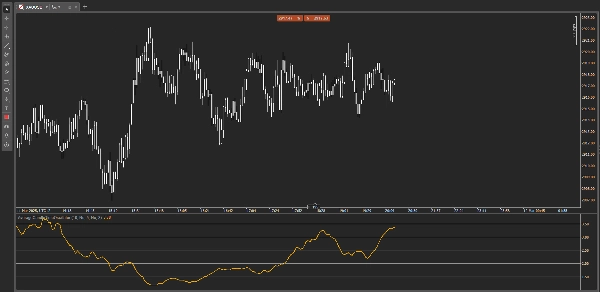
Oscylator Średniego Czasu Świecy (ACTO)
Zwiększ swoją efektywność handlową dzięki ACTO, zaawansowanemu oscylatorowi, który analizuje średni czas trwania świec na wykresie, umożliwiając szybkie wykrywanie zmian zmienności i aktywności rynku.
Dlaczego warto wybrać ACTO?
- Dokładny Pomiar Czasu Świecy: Łatwo wykrywaj wolne lub szybkie warunki rynkowe, aby optymalizować swoje wejścia i wyjścia.
- Dostosowywany Próg: Ustaw konkretne progi, aby wyróżnić kluczowe momenty i szybko reagować na zmiany rytmu rynku.
- Automatyczne Powiadomienia: Otrzymuj natychmiastowe powiadomienia, gdy średni czas trwania świecy przekroczy ustawiony próg, dzięki czemu nigdy nie przegapisz ważnych okazji handlowych.
- Przyjazny Interfejs: Prosty i intuicyjny wyświetlacz, odpowiedni dla traderów na każdym poziomie zaawansowania.
Idealny do skalpowania, day tradingu i handlu na krótkich interwałach czasowych, ACTO jest niezbędnym narzędziem dla każdego tradera, który chce przewidywać znaczące ruchy rynku na podstawie dynamiki czasu rynkowego.
Inne wskaźniki
Podsumowanie
Profil wskaźnika
Opinie klientów
4.5
Opinie: 2
5 | 50 % | |
4 | 50 % | |
3 | 0 % | |
2 | 0 % | |
1 | 0 % |
Opinie klientów
March 19, 2025
The product earns time when it gives the trader a reason to pause. Demo first makes more sense.
March 15, 2025
Bad impulses show up less often in the notes, but the market context still matters.
Dyskusja
Częste pytania
Scalping
Produkty dostępne za pośrednictwem cTrader Store, w tym boty handlowe, wskaźniki i wtyczki, dostarczane są przez deweloperów zewnętrznych i udostępniane wyłącznie w celach informacyjnych oraz w celu zapewnienia dostępu technicznego. cTrader Store nie jest brokerem i nie zapewnia doradztwa inwestycyjnego, nie udziela spersonalizowanych rekomendacji ani nie gwarantuje przyszłych wyników.
Więcej od tego autora


Cena
378.94M
Wolumen transakcji
1.9M
Zysk w pipsach