Indicator
Breakout
Pivot Points Daily Session
"Pivot Points Daily Session" logo
5.0
03/09/2025
27
Desktop
Since 30/09/2024
Sales
34
"Pivot Points Daily Session" uploaded image"Pivot Points Daily Session" uploaded image"Pivot Points Daily Session" uploaded image"Pivot Points Daily Session" uploaded image"Pivot Points Daily Session" uploaded image

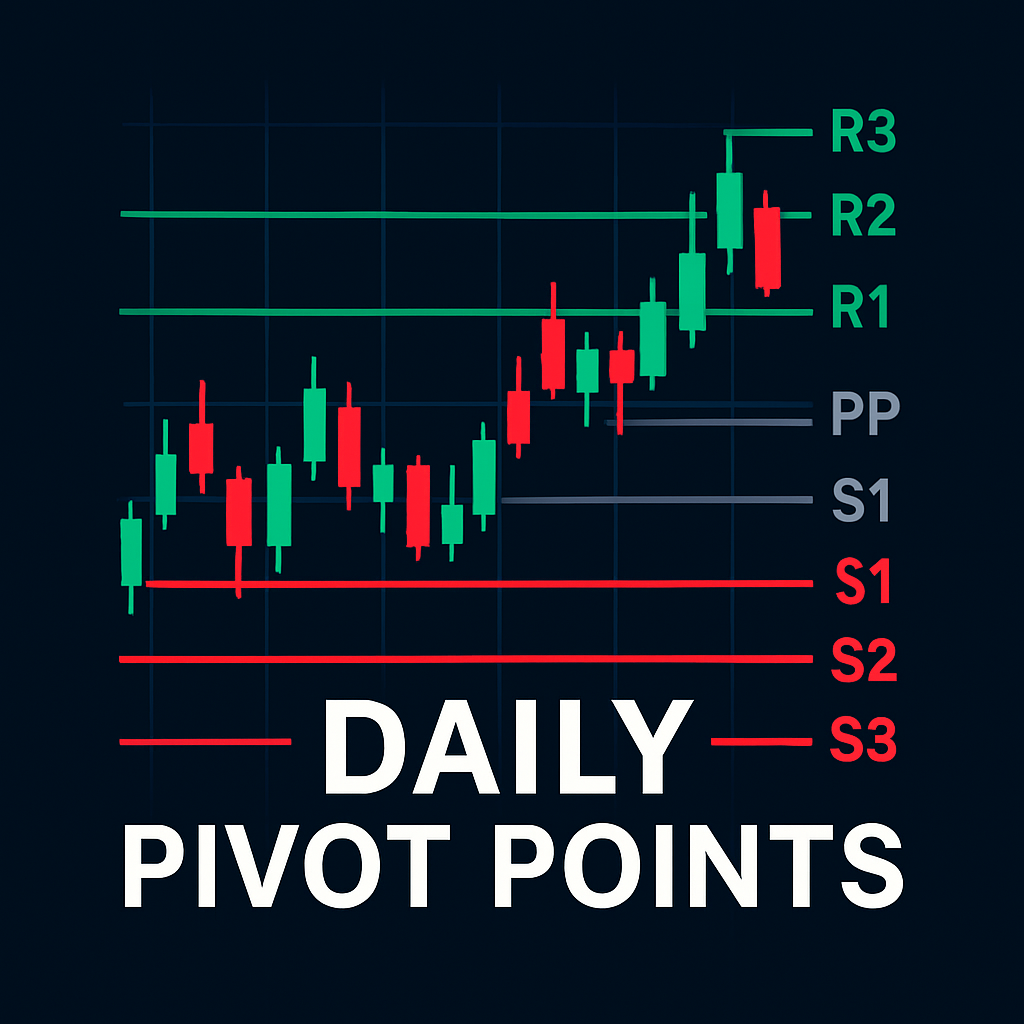
Here is the formula for calculating standard Pivot Points:

PP = (High + Low + Close)/3

S1 = (PP * 2) – High

S2 = PP – (High – Low)

S3 = Low – 2(High – PP)

R1 = (PP * 2) – Low

R2 = PP + (High – Low)

R3 = High + 2(PP – Low)

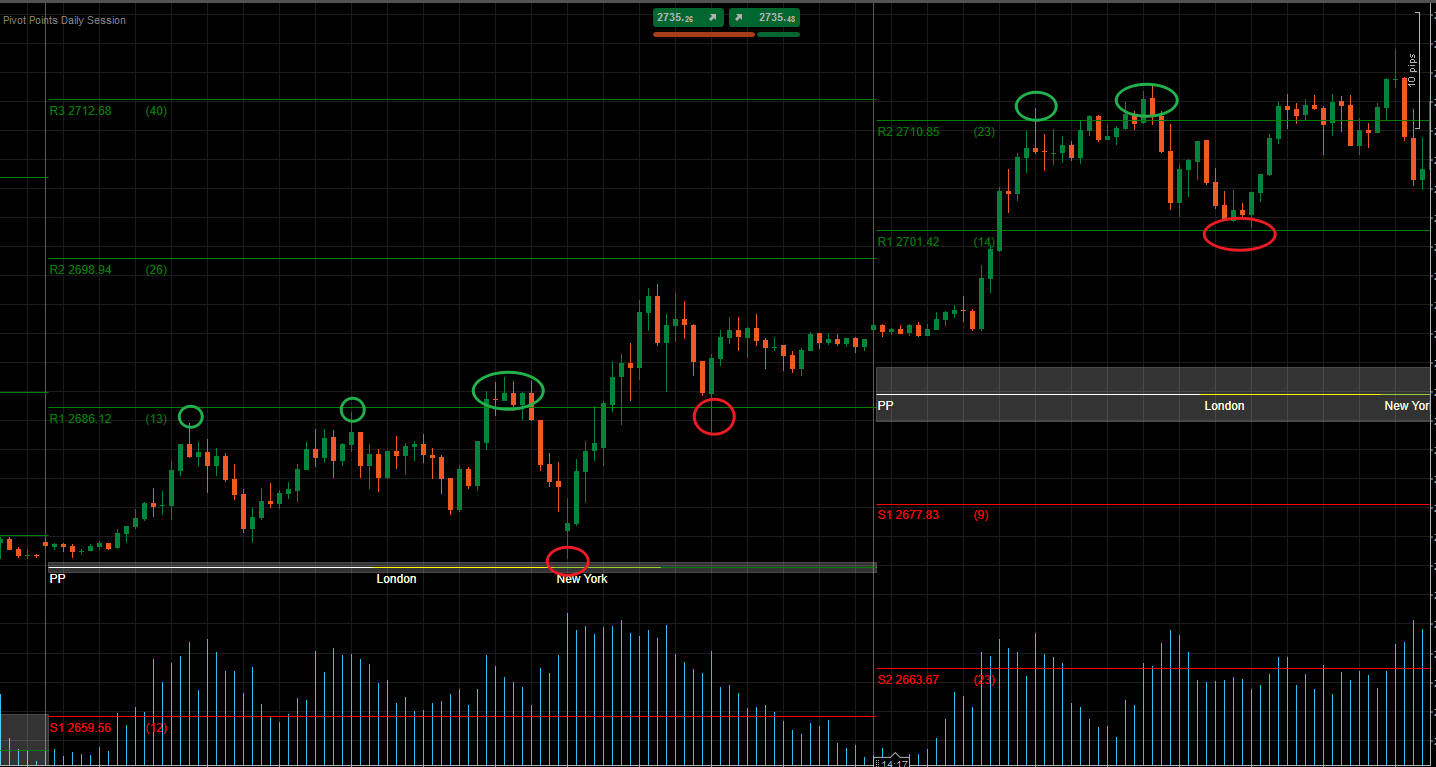
Pivot points can be used to identify the overall trend, since a move through pivot points to the upside indicates an uptrend. Meanwhile the opposite, where a price continues to fall below pivot points during a session, is indicative of a downtrend.

In a ranging market, traders can simply sell (go short) at resistance and buy (go long) at support. For instance, if the market is contained between R1 and S1, buy orders will be placed around S1, with sell orders placed around R1.

In a trending market, relevant Pivot Points will act as reference points for retracing markets to resume the main trend. For instance, if the prices are above PP during an uptrend but below R2. Traders can look to place lucrative buy orders around R1.  

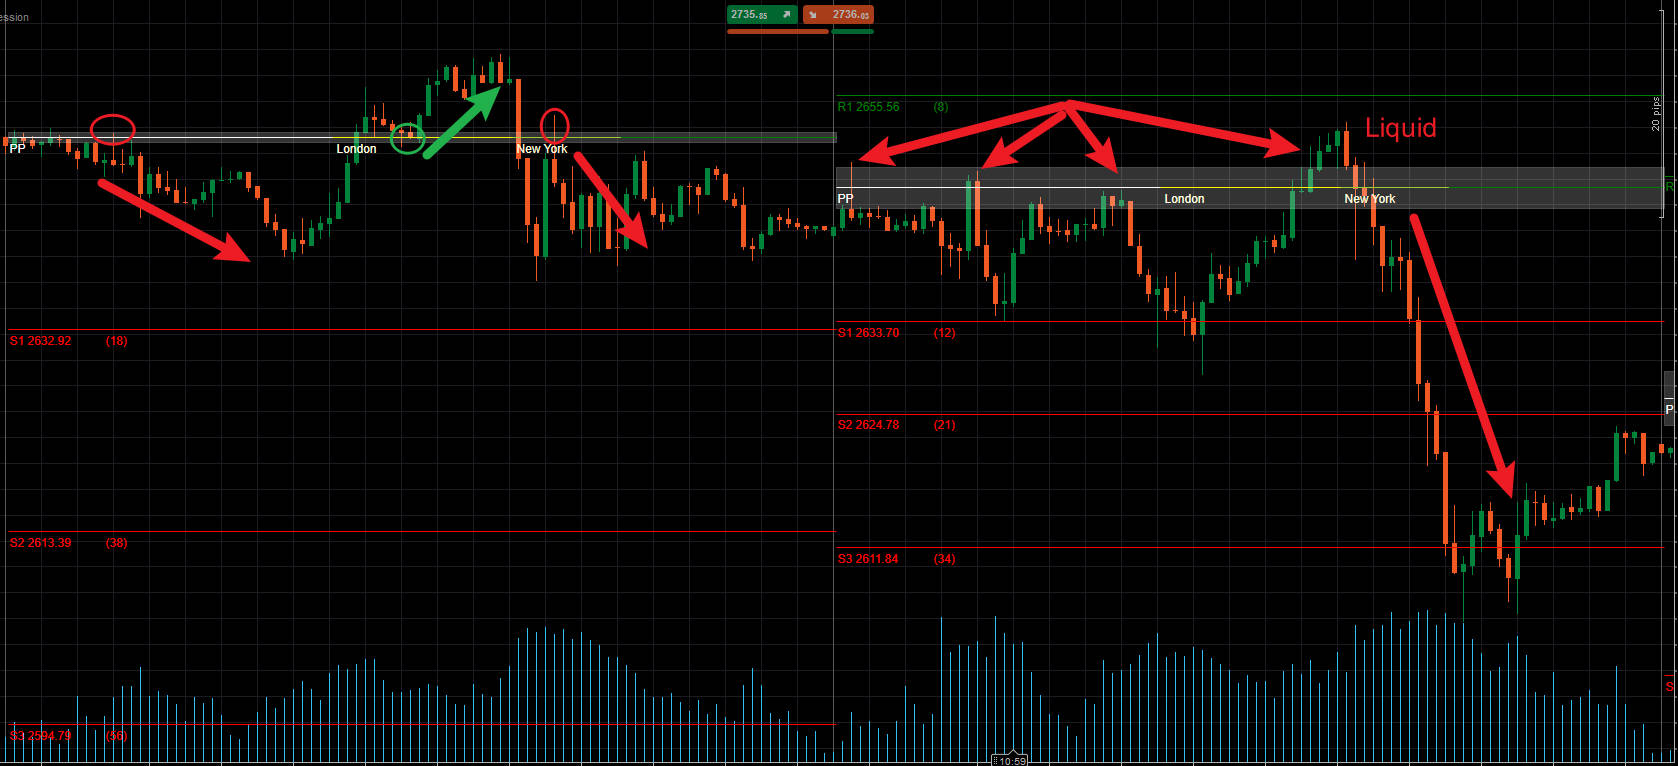
Support and resistance levels are bound to be broken in some in the market. These breakout periods can offer many trading opportunities in the market. Pivot points can also be used to trade potential price breakouts in the market.

Price breakouts occur when the price surges through an existing support or resistance level and effectively switches its role. For instance, if a downward breakout occurs at S2, the pivot line will cease to be a support line and will now be considered a line of resistance.

In this scenario, only sell orders will be considered below S2, and other pivot lines can guide stop loss and take profit placement. Stop losses for sell orders can be placed above S2 and S1, with profit targets placed at S3 and below.

Issues:

EMail:pengzuyun@gmail.com
More from this author
Volume Weighted Average Price
VWAP is a powerful tool for intraday traders
IRiskRewardTools
Risk Reward Management Tools(风险回报管理工具)
Indicator
RSI
Breakout
MACD
ZigZagColor
The ZigZag indicator is a technical analysis tool primarily used to identify key price reversal points.
SuperEmaColorRSI
This is a super indicator that integrates the RSI indicator with a dual moving average system.
You may also like
Head Shoulders Finder
Detects Head & Shoulders patterns, plots signals, and alerts for trading opportunities.
Indicator
ATR
Supertrend
supertrend
Supertrend Indicator for cTrader
Volume-Powered Market Flow Projector
Project market behavior by integrating price and volume data across multiple time dimensions
Anchored VWAP Buttons
Indicator
RSI
Commodities
Signal
+1
Dot Momentum %BB Indicator
Dynamic circles visualize price's volatility position. Like RSI for market overextension & stretch. Quantify context.
Indicator
RSI
MACD
SmartBot-MACD & RSI Indicator
This indicator is a combination of MACD and RSI into one. This is perfect fusion and powerful indicator ever.
Indicator
RSI
XAUUSD
Breakout
+7
Candle Strength Oscillator
The Candle Pressure Index is a powerful, user-friendly indicator that reveals hidden market pressure inside candles.
Indicator
Indices
Forex
POC session line
Displays the POC line for previous sessions in an easy to see manner.
Indicator
Indices
Prop
XAUUSD
+8
Phoenix Zones
Phoenix Zones - Detector de Reversiones Críticas
DailyPivotPoints
Daily Pivot Points plots key support and resistance levels to guide precise trading decisions.
market session
Market session indicator (Asia, Frankfurt, New York, London)
Open Trade ProfitV1
A simple indicator that tracks the value of your open trades in pips.
Indicator
Indices
E7 BlackScholes Model
Option pricing using the BlackScholes model and the Math.Numerics packages
VegaXLR - Candlestick Patterns Alerts
Real-Time Candlestick Pattern Detection with Custom Alerts & Trend Analysis for cTrader
Candlestick Patterns - Special Candles
Boost your trading with Candlestick Patterns for cTrader – auto-detect key signals for smarter, faster decisions!
Indicator
RSI
Breakout
XAUUSD
+5
Prediction Based on Linreg & ATR
📊Predicts price movement by combining multi-timeframe trend analysis, market volatility 📉, and..
FREEE Tradingview Economic Calendar on Chart
Customizable window inside your platform, access to any website Calendar Was Free for early users now -50%
Repiptor RSI Amplified
RSI Amplified