Indicator
Indices
Forex
POC session line
"POC session line" logo
10/09/2025
Desktop
"POC session line" uploaded image"POC session line" uploaded image

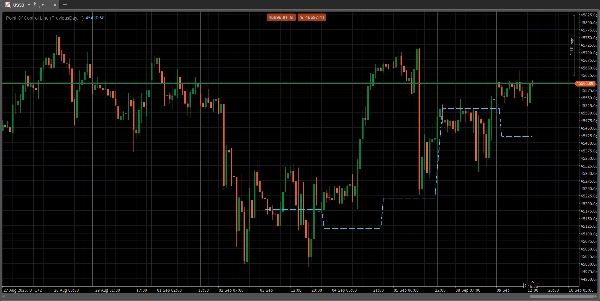
The Point of Control (POC) is a price level on a volume profile chart where the most trading volume has been conducted within a specified period. This level acts as a significant support or resistance zone because it represents a price where large trading institutions were most active and where market price found consensus. Traders use the POC to identify key price zones, gauge market sentiment, and anticipate potential price movements and reversals.

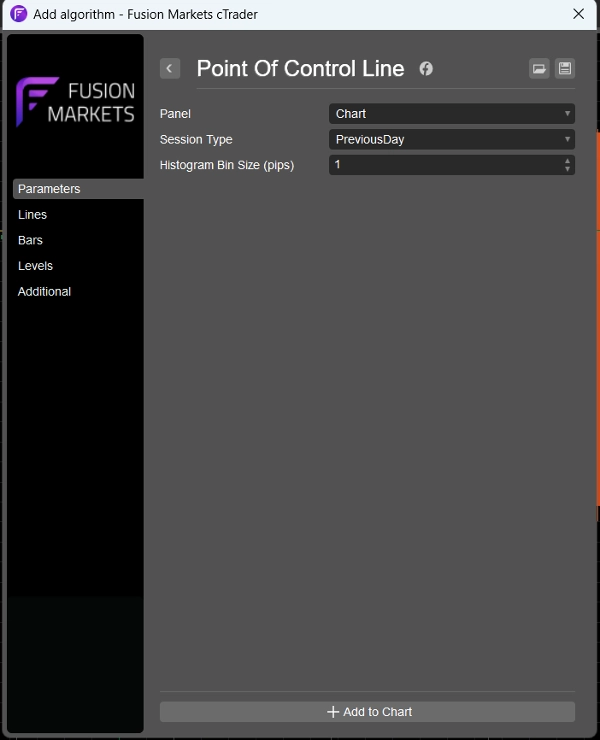
I have removed all the noise from the usual volume profile indicators leaving just the POC line for those who only require the line. I have included a parameter to view the POC line for either the previous day, 4hr or 1hr volume profile so it is suitable for traders of different timeframes.

You may also like
Indicator
Breakout
Stocks
Commodities
+1
Advanced Donchian Zones
MTF Donchian: Identify trend breakouts & key zones with precision. Perfect for swing & day traders seeking accuracy!
Indicator
Grid
RSI
ATR
+6
PFO Price Flow Oscillator
technical analysis tool designed to provide traders with a structured view of market momentum and volatility
Indicator
NAS100
NZDUSD
XAUUSD
+12
Coral Filter X Pro
🐠 Coral Filter X Pro turns trend detection into a simple, repeatable workflow 🐠
Indicator
VWAP
NAS100
XAUUSD
+7
Vwap Manav Indi Button
Automated VWAP bot executes trades at key volume-weighted average price zones with adaptive risk management
Indicator
Breakout
AI
Scalping
KaufmanEfficiencyRatio
A precision tool for measuring how efficiently price moves from point A to B.
Order Block detector PRO
Order Block PRO — Smart Institutional Zone Detector
BarCount
Bar count
Indicator
NAS100
NZDUSD
XAUUSD
+13
ORDERFLOW_SKIA_Plynuly
This Indicator will show you Direction, Distance, and Time;
overbought oversold
Overbought Oversold Indicator
Volume-Powered Market Flow Projector
Project market behavior by integrating price and volume data across multiple time dimensions
Advanced Market Structure Bos,Choch,SwinLevels, Order Blog
Advanced price action tool that combines multiple technical analysis concepts
IR Moving Average
 this moving include everything that a trader needs from Moving Average.
Indicator
Breakout
Forex
support and resistance
Support and Resistance Line Indicator with Higher Timeframe Filter
Indicator
Indices
Prop
Commodities
+3
OBScope
A cutting-edge indicator designed to detect and visualize high-probability zones based on swing highs, swing lows.
Indicator
NAS100
NZDUSD
XAUUSD
+14
Volume Profile Pivot Anchored
Anchor volume profiles to pivots with POC, VAH, VAL and real-time insights for clearer trade decisions.
Candle Timer & Strength Panel Demo -
Candle Timer & Strength Panel DEMO for cTrader DEMO VERSION – 24 hours free trial! This is a DEMO version of the Candle
Indicator
RSI
XAUUSD
Breakout
+4
ICT Power of 3
🎯 Auto-plots key zones (Accumulation, Manipulation, Distribution) . Reveals institutional traps & trends.
Wstęgi DoubleSMMA
Wstęgi HTS