Daily SD Levels - Indicator
06/08/2025
2
Desktop
Since 16/07/2025
Sales
2
.png)
.png)
.png)
.png)
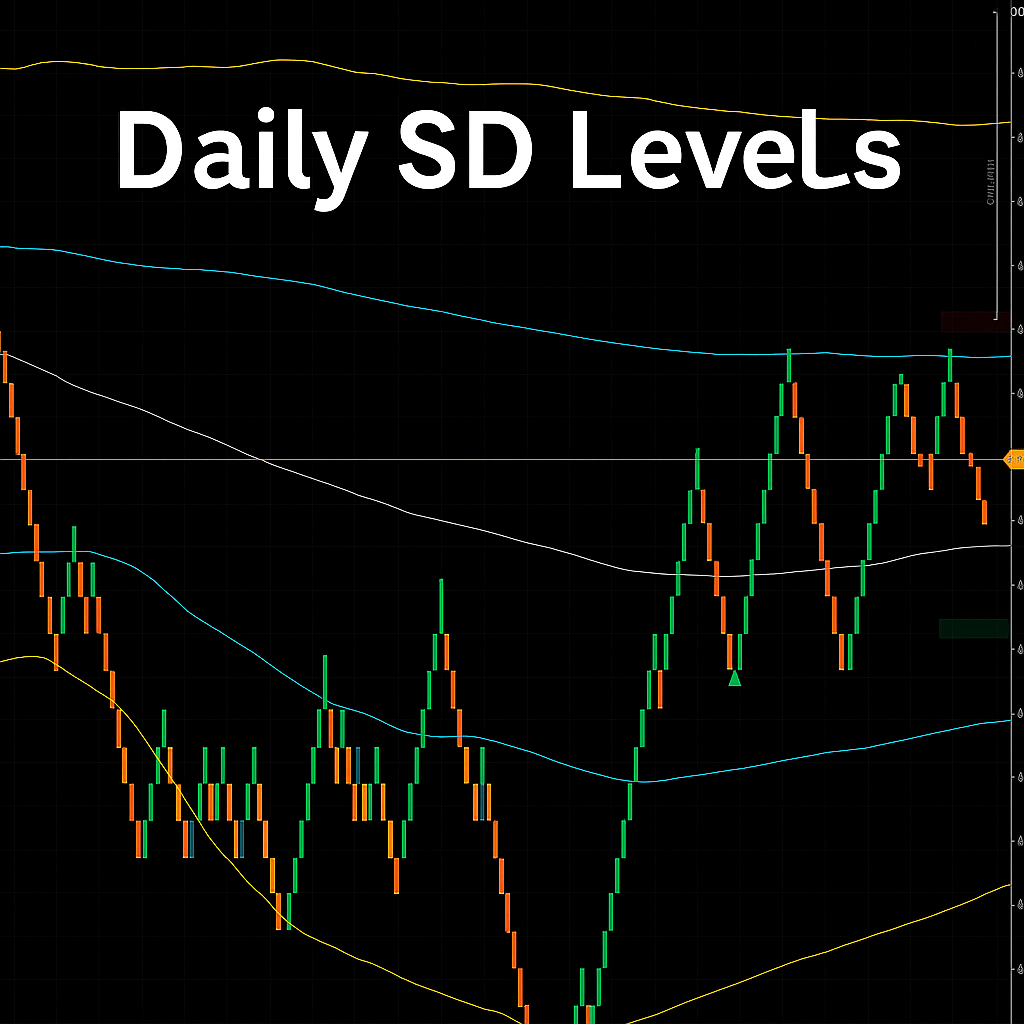
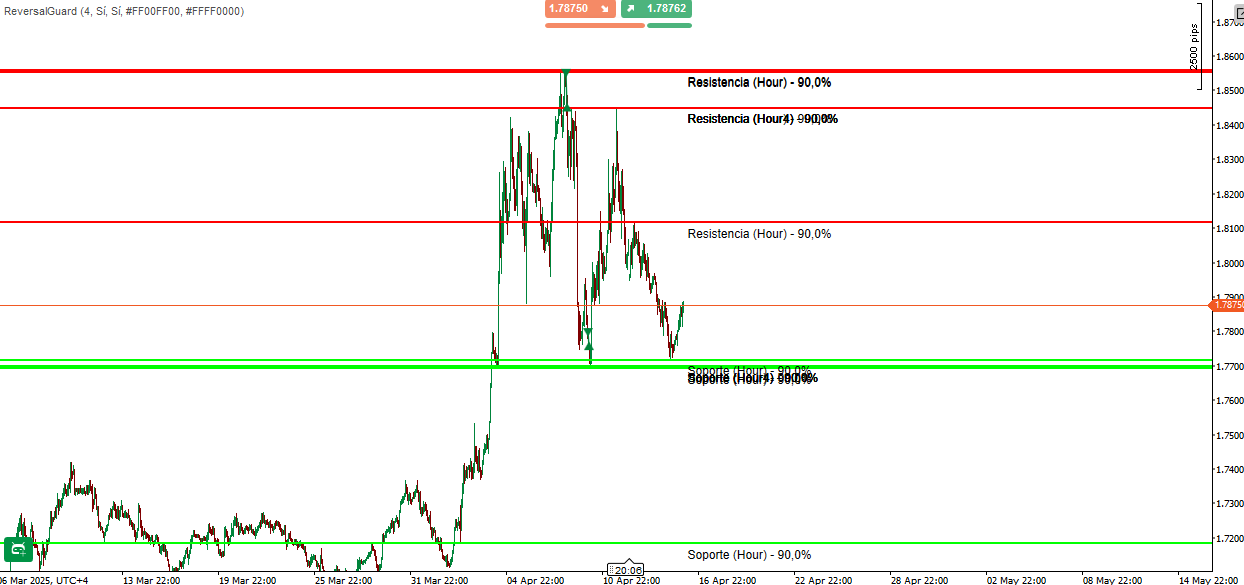
Daily SD Levels – Dynamic VWAP-Based Standard Deviation Bands
The Daily SD Levels indicator plots dynamic VWAP (Volume-Weighted Average Price) and Standard Deviation Bands (+1/+2 and -1/-2) calculated over the current trading day.
This tool helps traders visually assess intraday volatility, potential support/resistance zones, and price extremes, all based on actual market volume and price action – not fixed or arbitrary levels.
Key Features:
- VWAP Line for intraday fair value tracking.
- +1/+2 and -1/-2 SD Bands to identify overbought/oversold zones.
- Levels reset daily, adapting to each session’s price and volume dynamics.
- Optimized for Renko, Range Bar, and Intraday Trading.
- Built for traders who need clarity and dynamic price zones.
This indicator is perfect for:
- Mean reversion setups.
- Identifying stretched moves for possible reversals.
- Visual confirmation of breakouts beyond statistical boundaries.
No clutter. Just clean, responsive levels that move with the market.
You may also like


Indicator
Signal
DARK POLL SIGNAL_noSourceCode
Dark Poll Signal Indicator.liquidity leakage,precedes the great movement, accumulation, distribution


Indicator
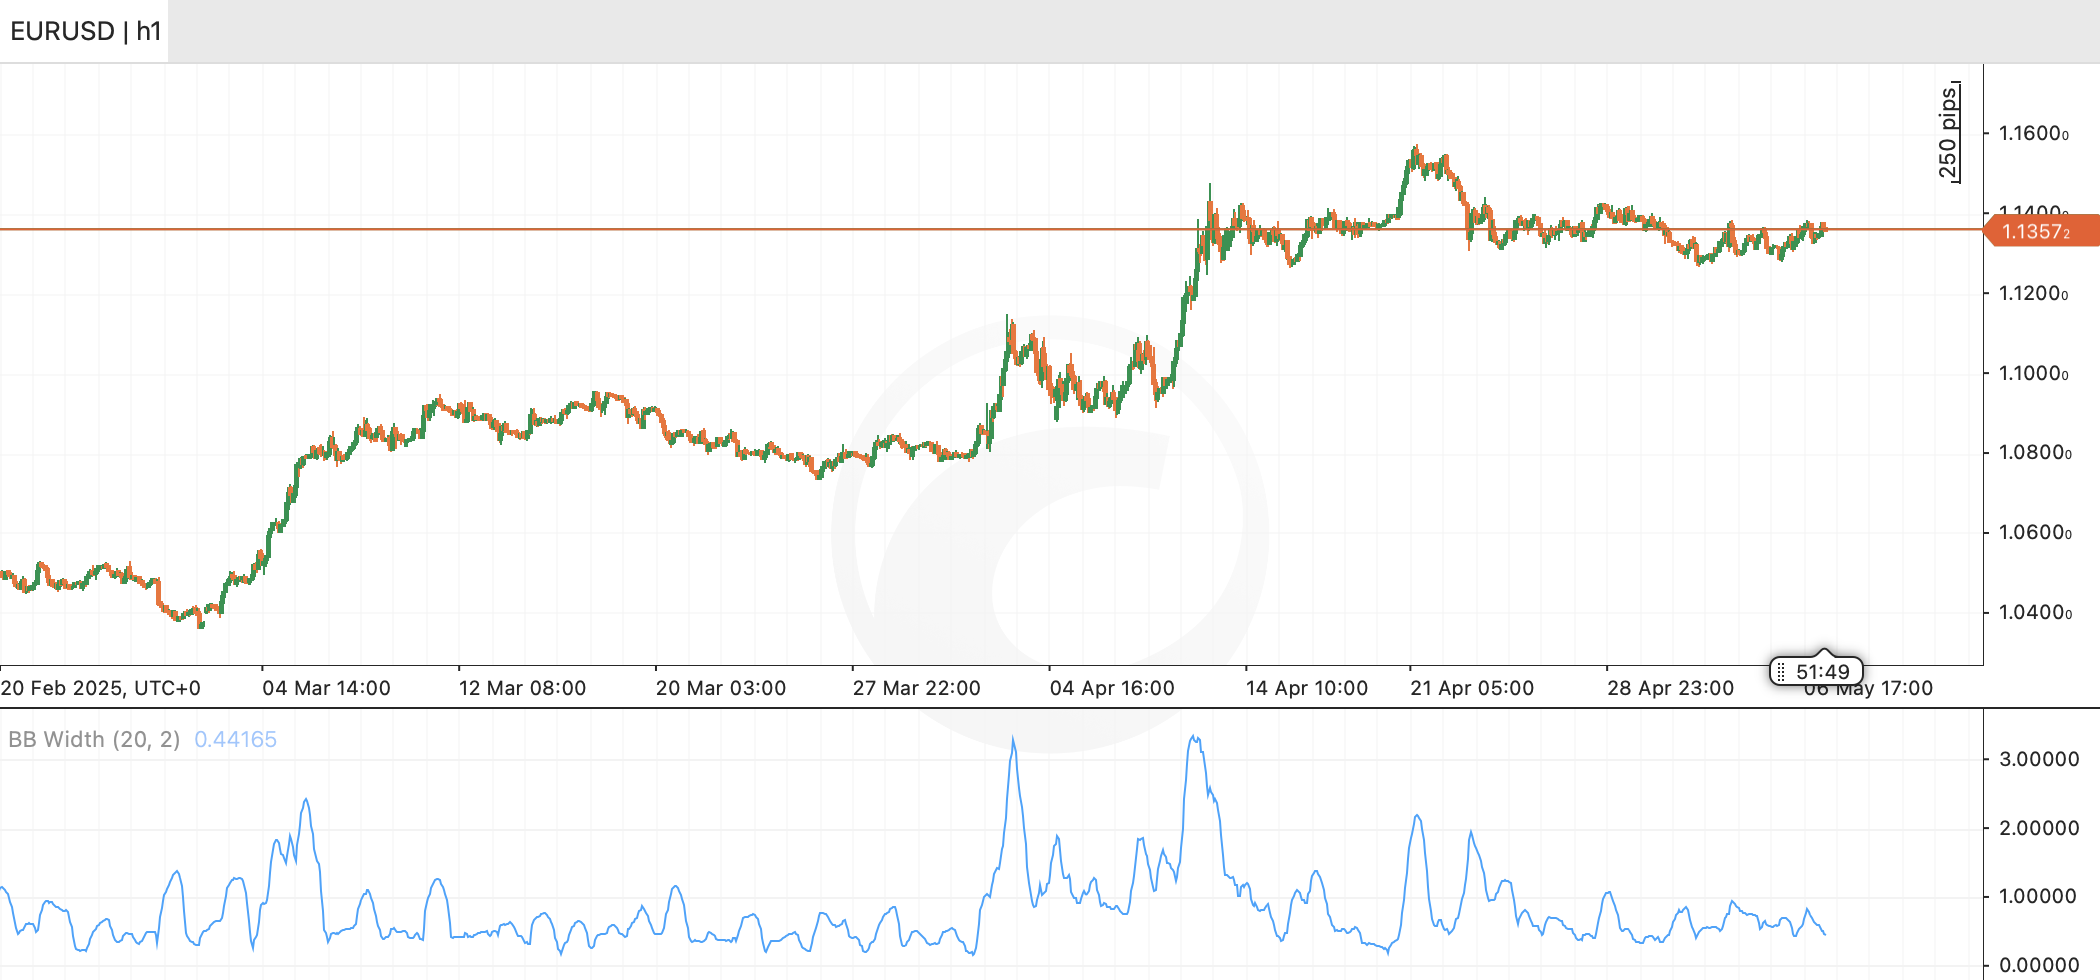
Bollinger
BB Width
Indicatore di volatilità che filtra quando le bande di Bollinger sono in espansione
Top-rated
Indicator
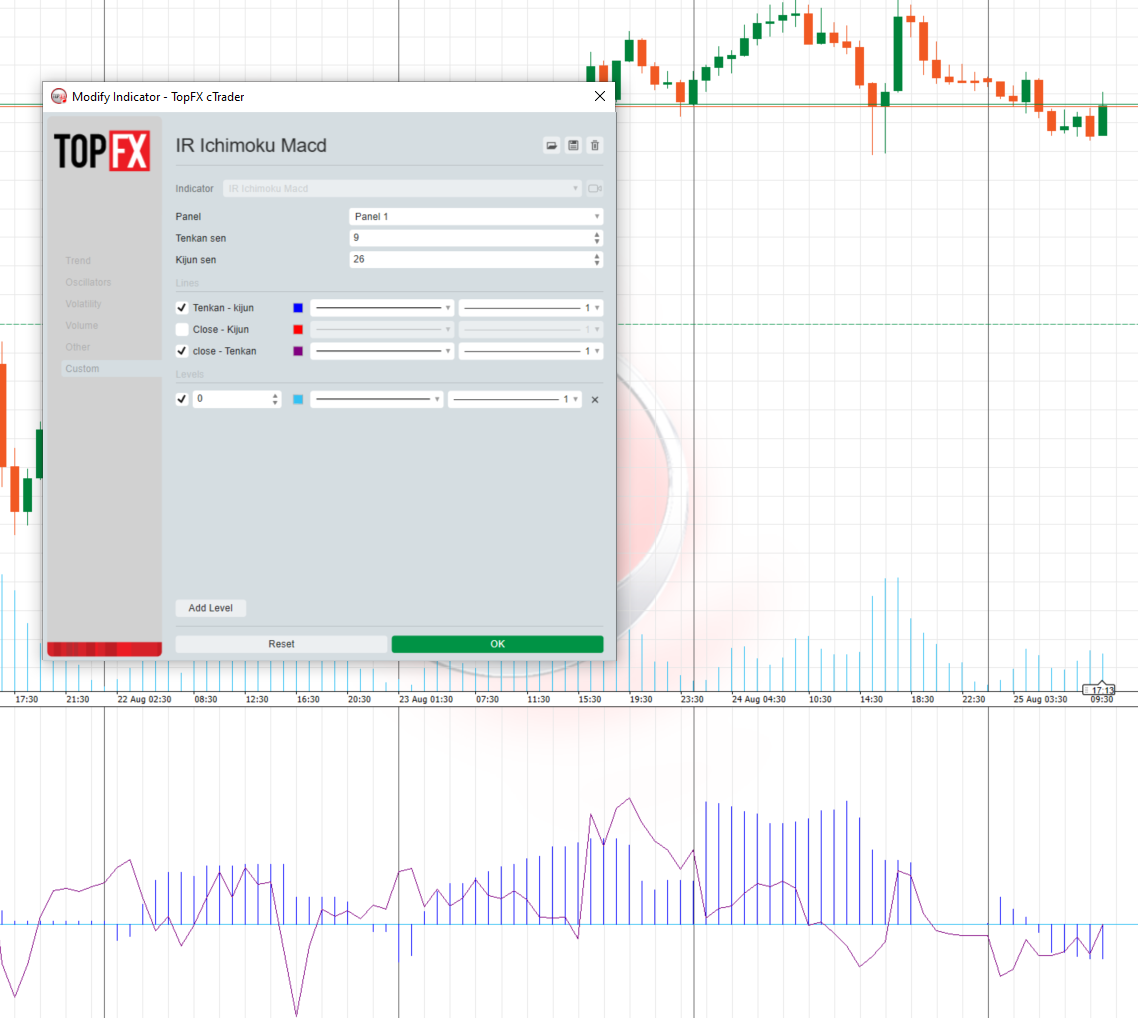
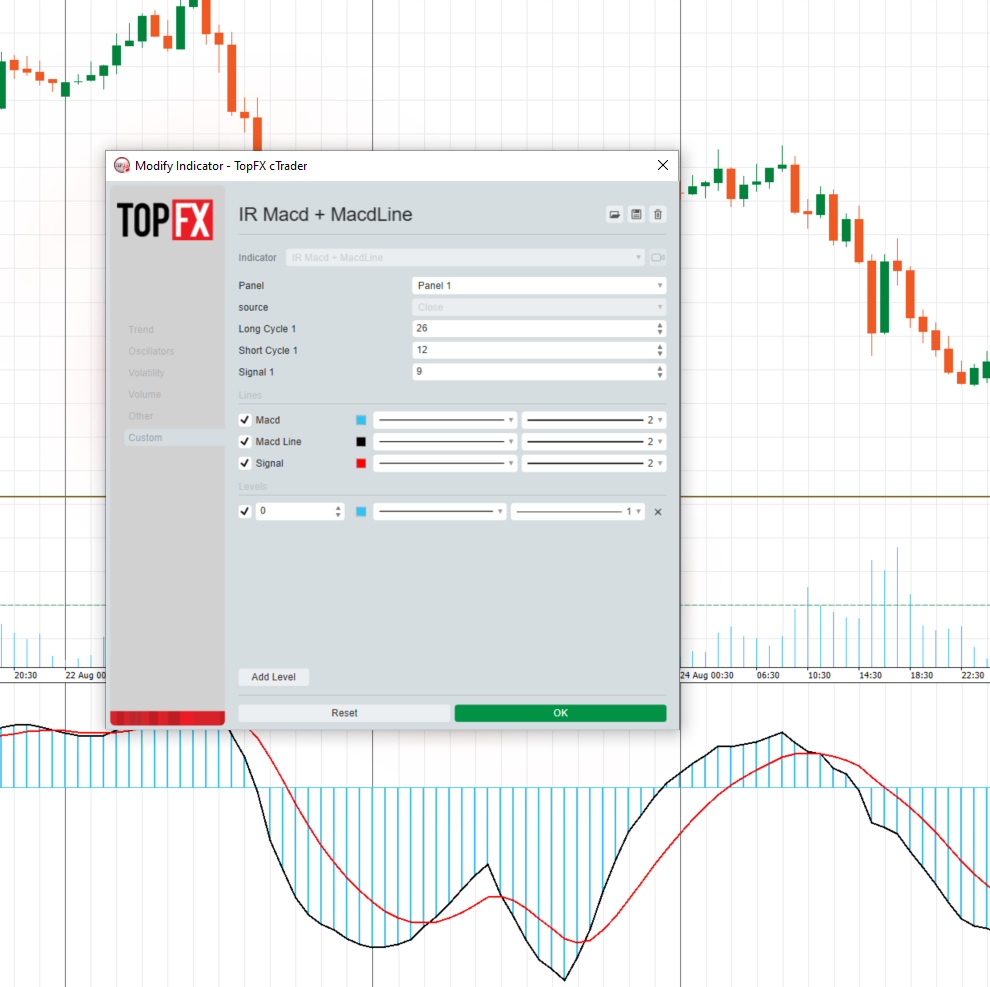
MACD
IR Macd + MacdLine
some user add moving average to macd to see better. in ctrader 4.3.11 there is a problem with this . I make a macd tha