50 percent

24/08/2025
Desktop

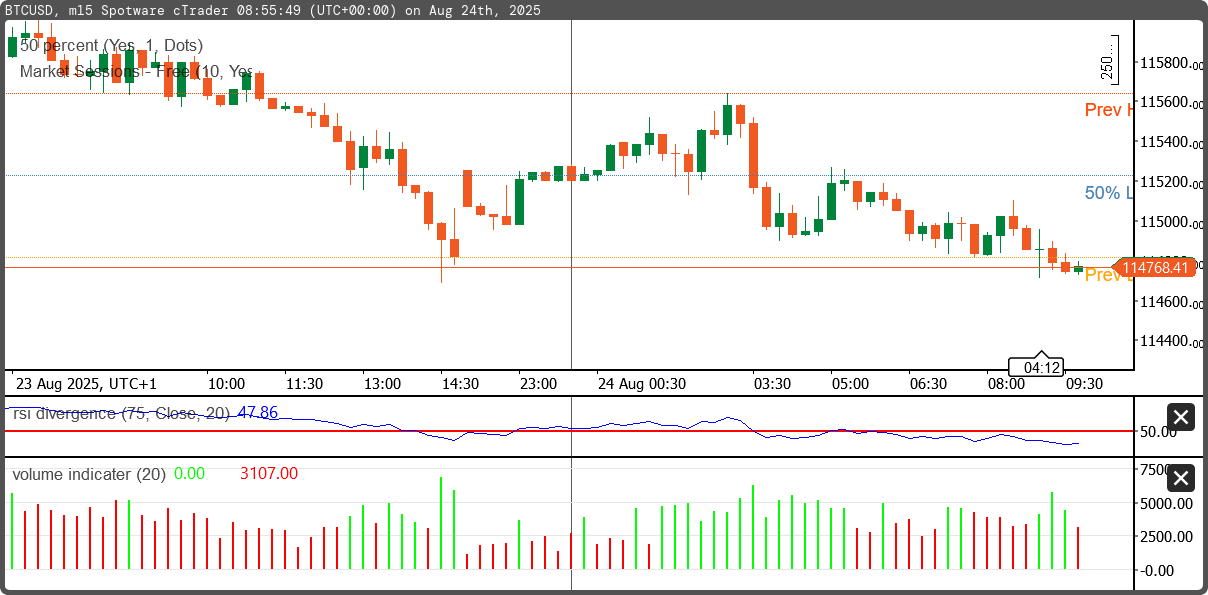
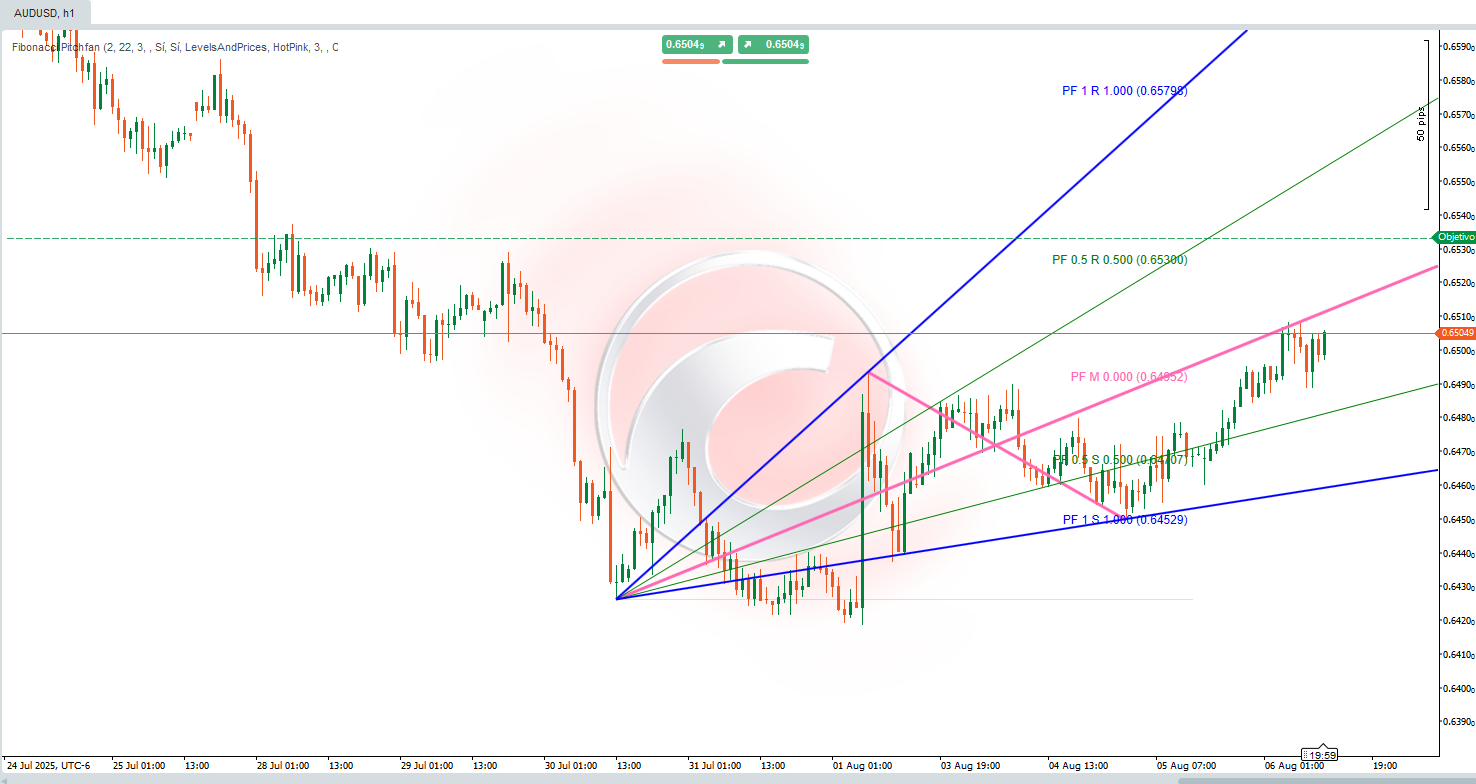
This cBot automatically detects the previous session’s high and low prices and calculates the midpoint between them. It is designed to assist traders by identifying key support/resistance zones and market equilibrium levels, which are often used for reversal or breakout strategies.
- Detects the previous day’s (or session’s) high and low.
- Calculates the midpoint between the high and low.
- Plots the high, low, and midpoint levels on the chart.

You may also like


.jpeg)


Indicator
Indices
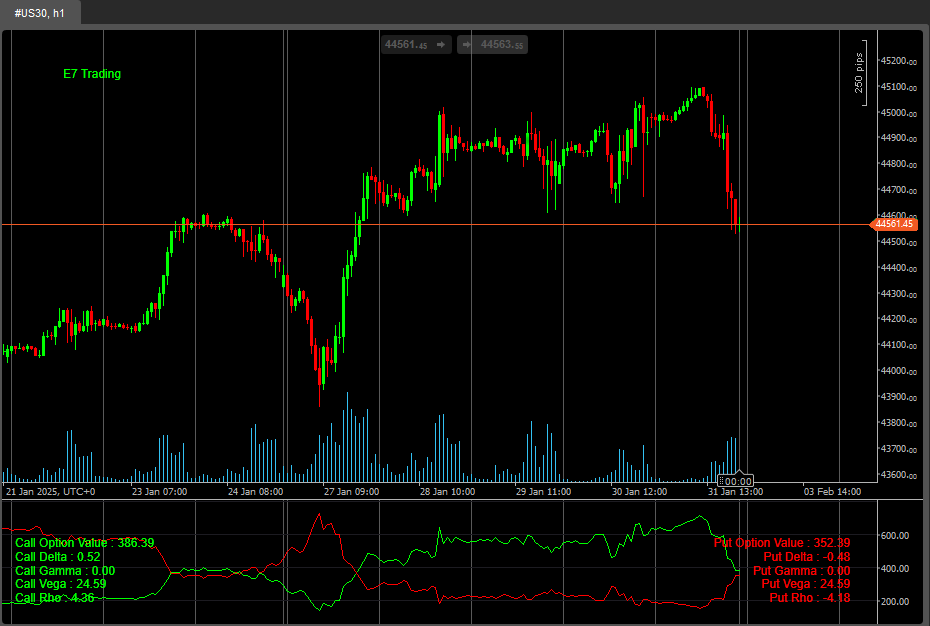
E7 BlackScholes Model
Option pricing using the BlackScholes model and the Math.Numerics packages


Top-rated
Indicator
Forex
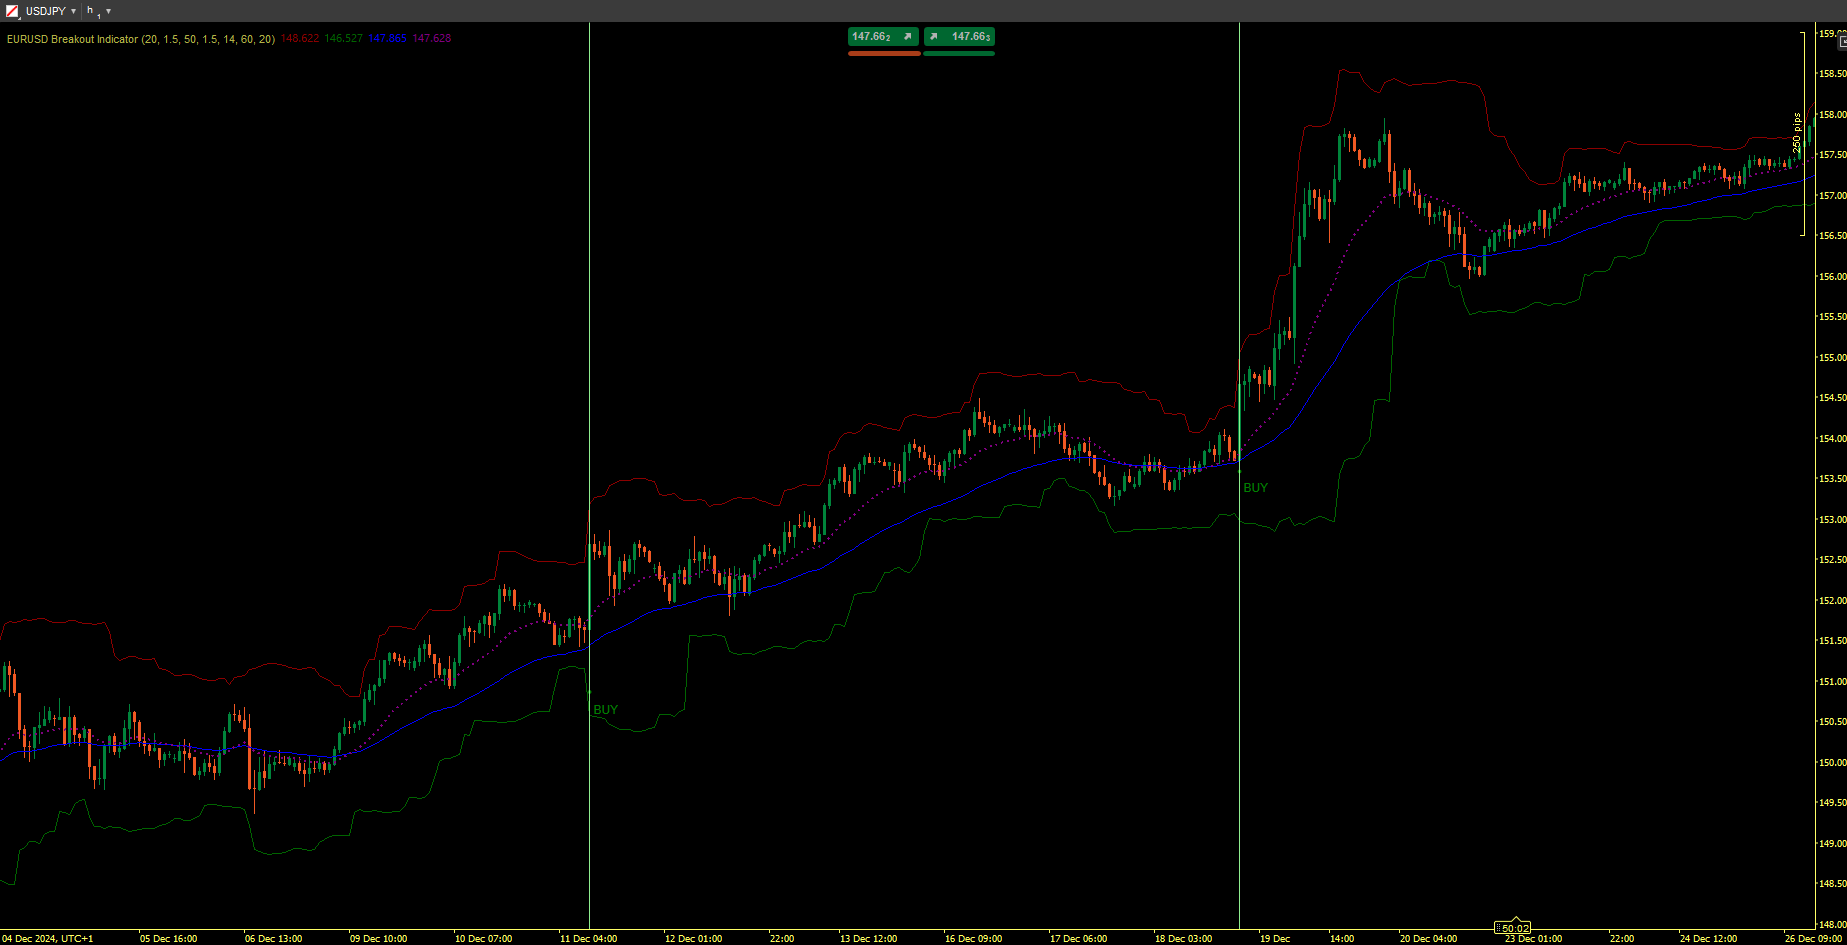
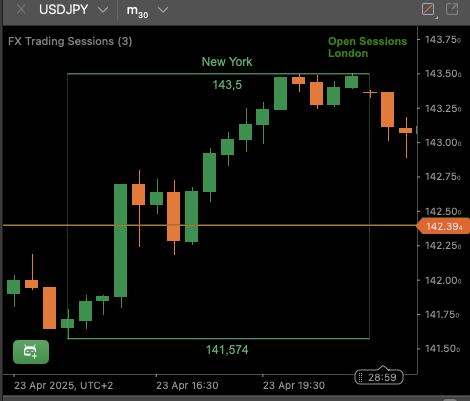
FX Market Sessions
Easily visualise Forex sessions with start/end markers and high/low levels for Sydney, Tokyo, London, and New York.