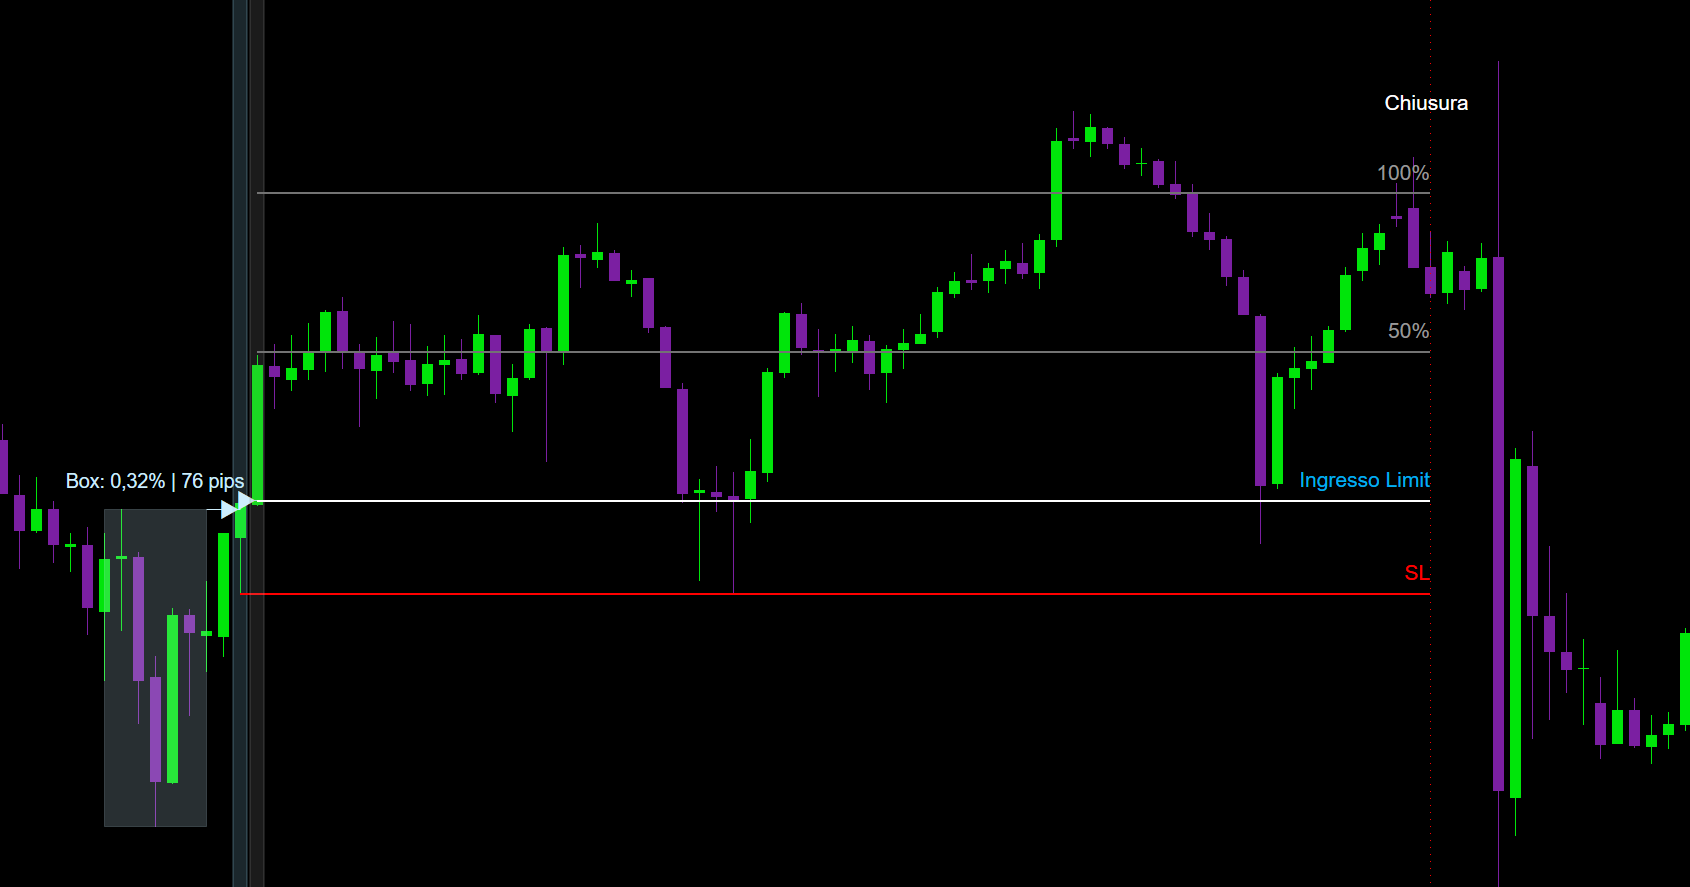
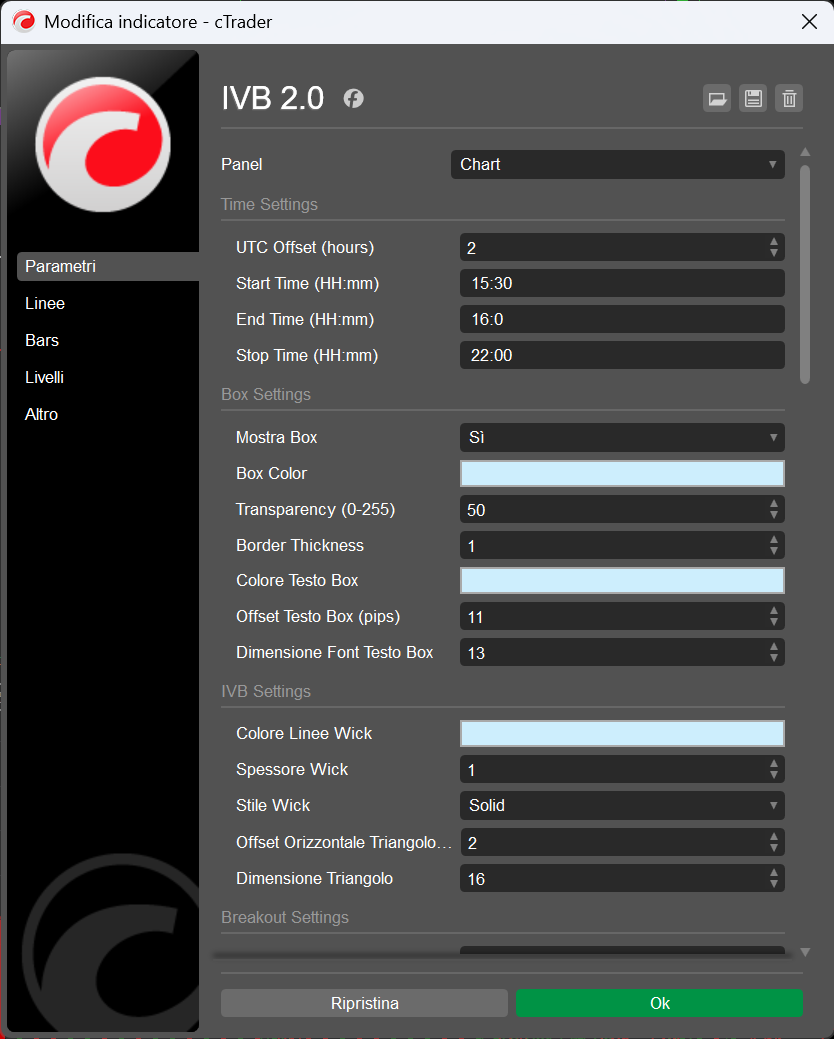
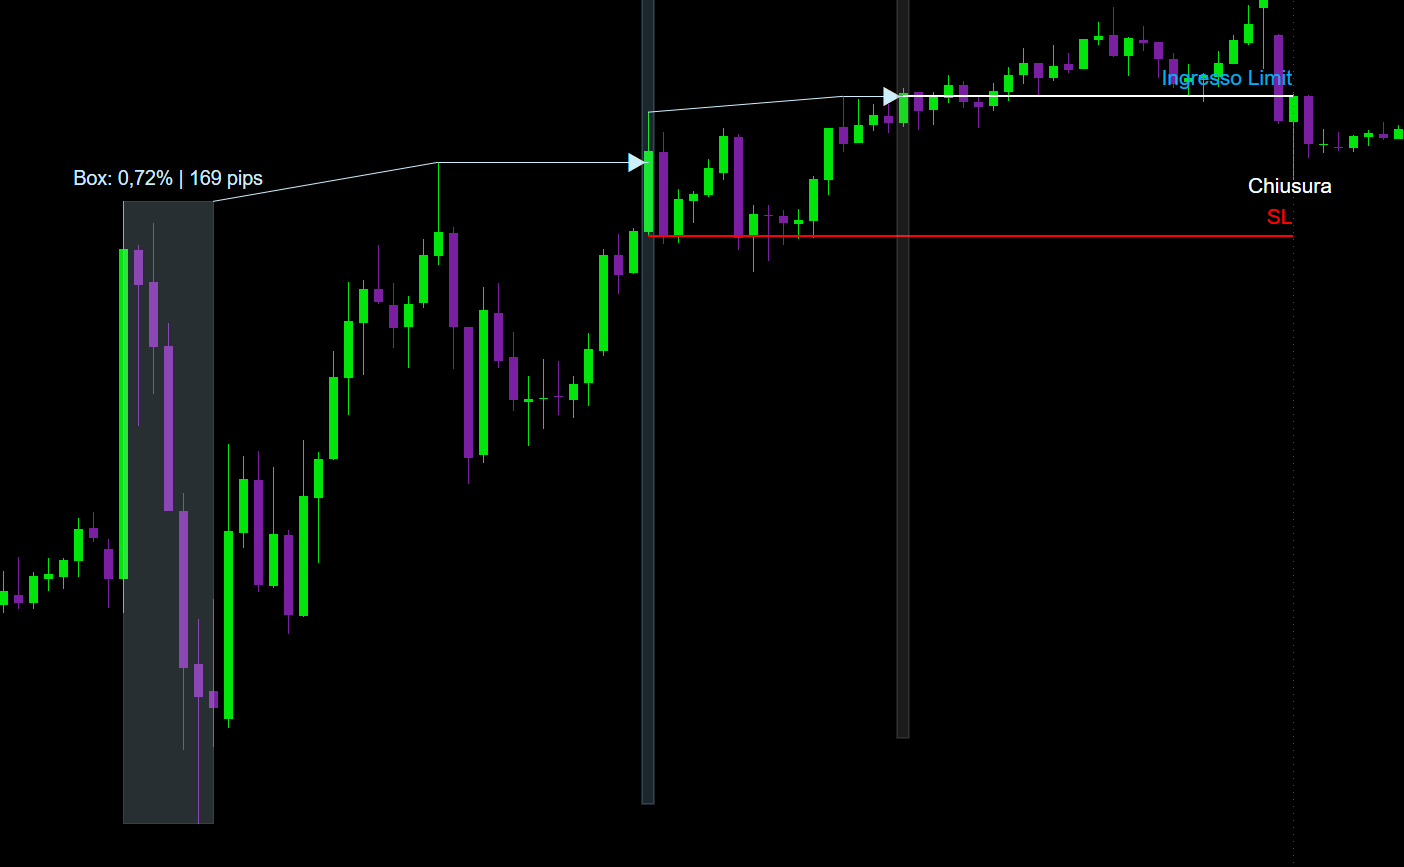
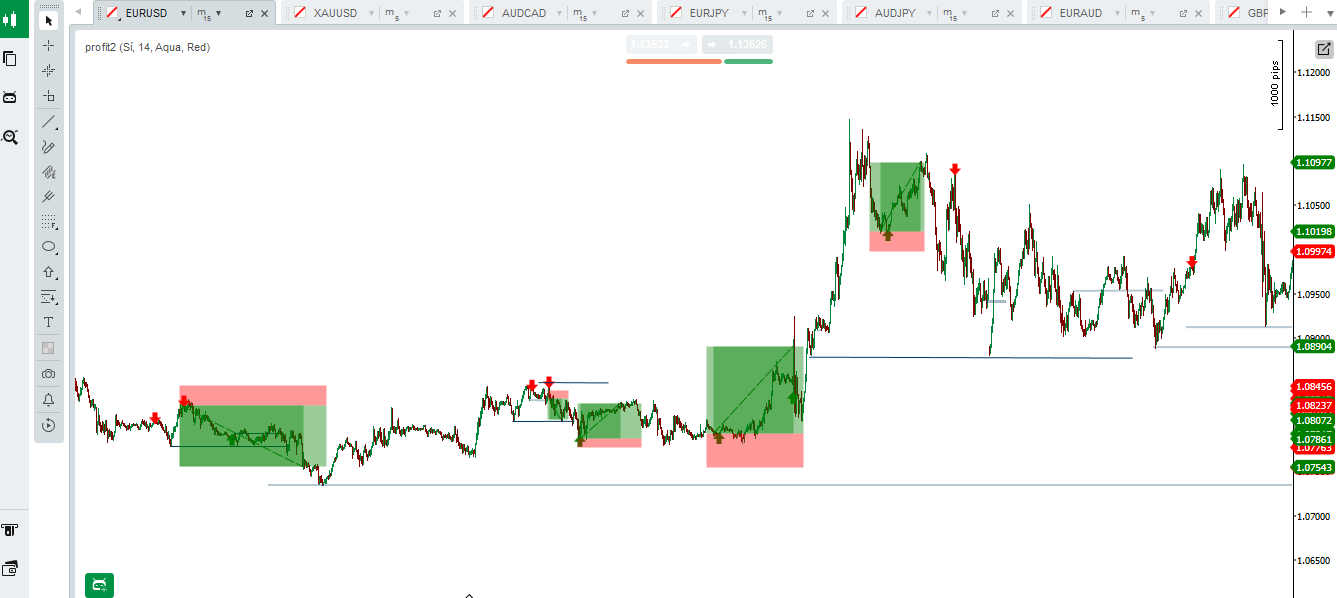
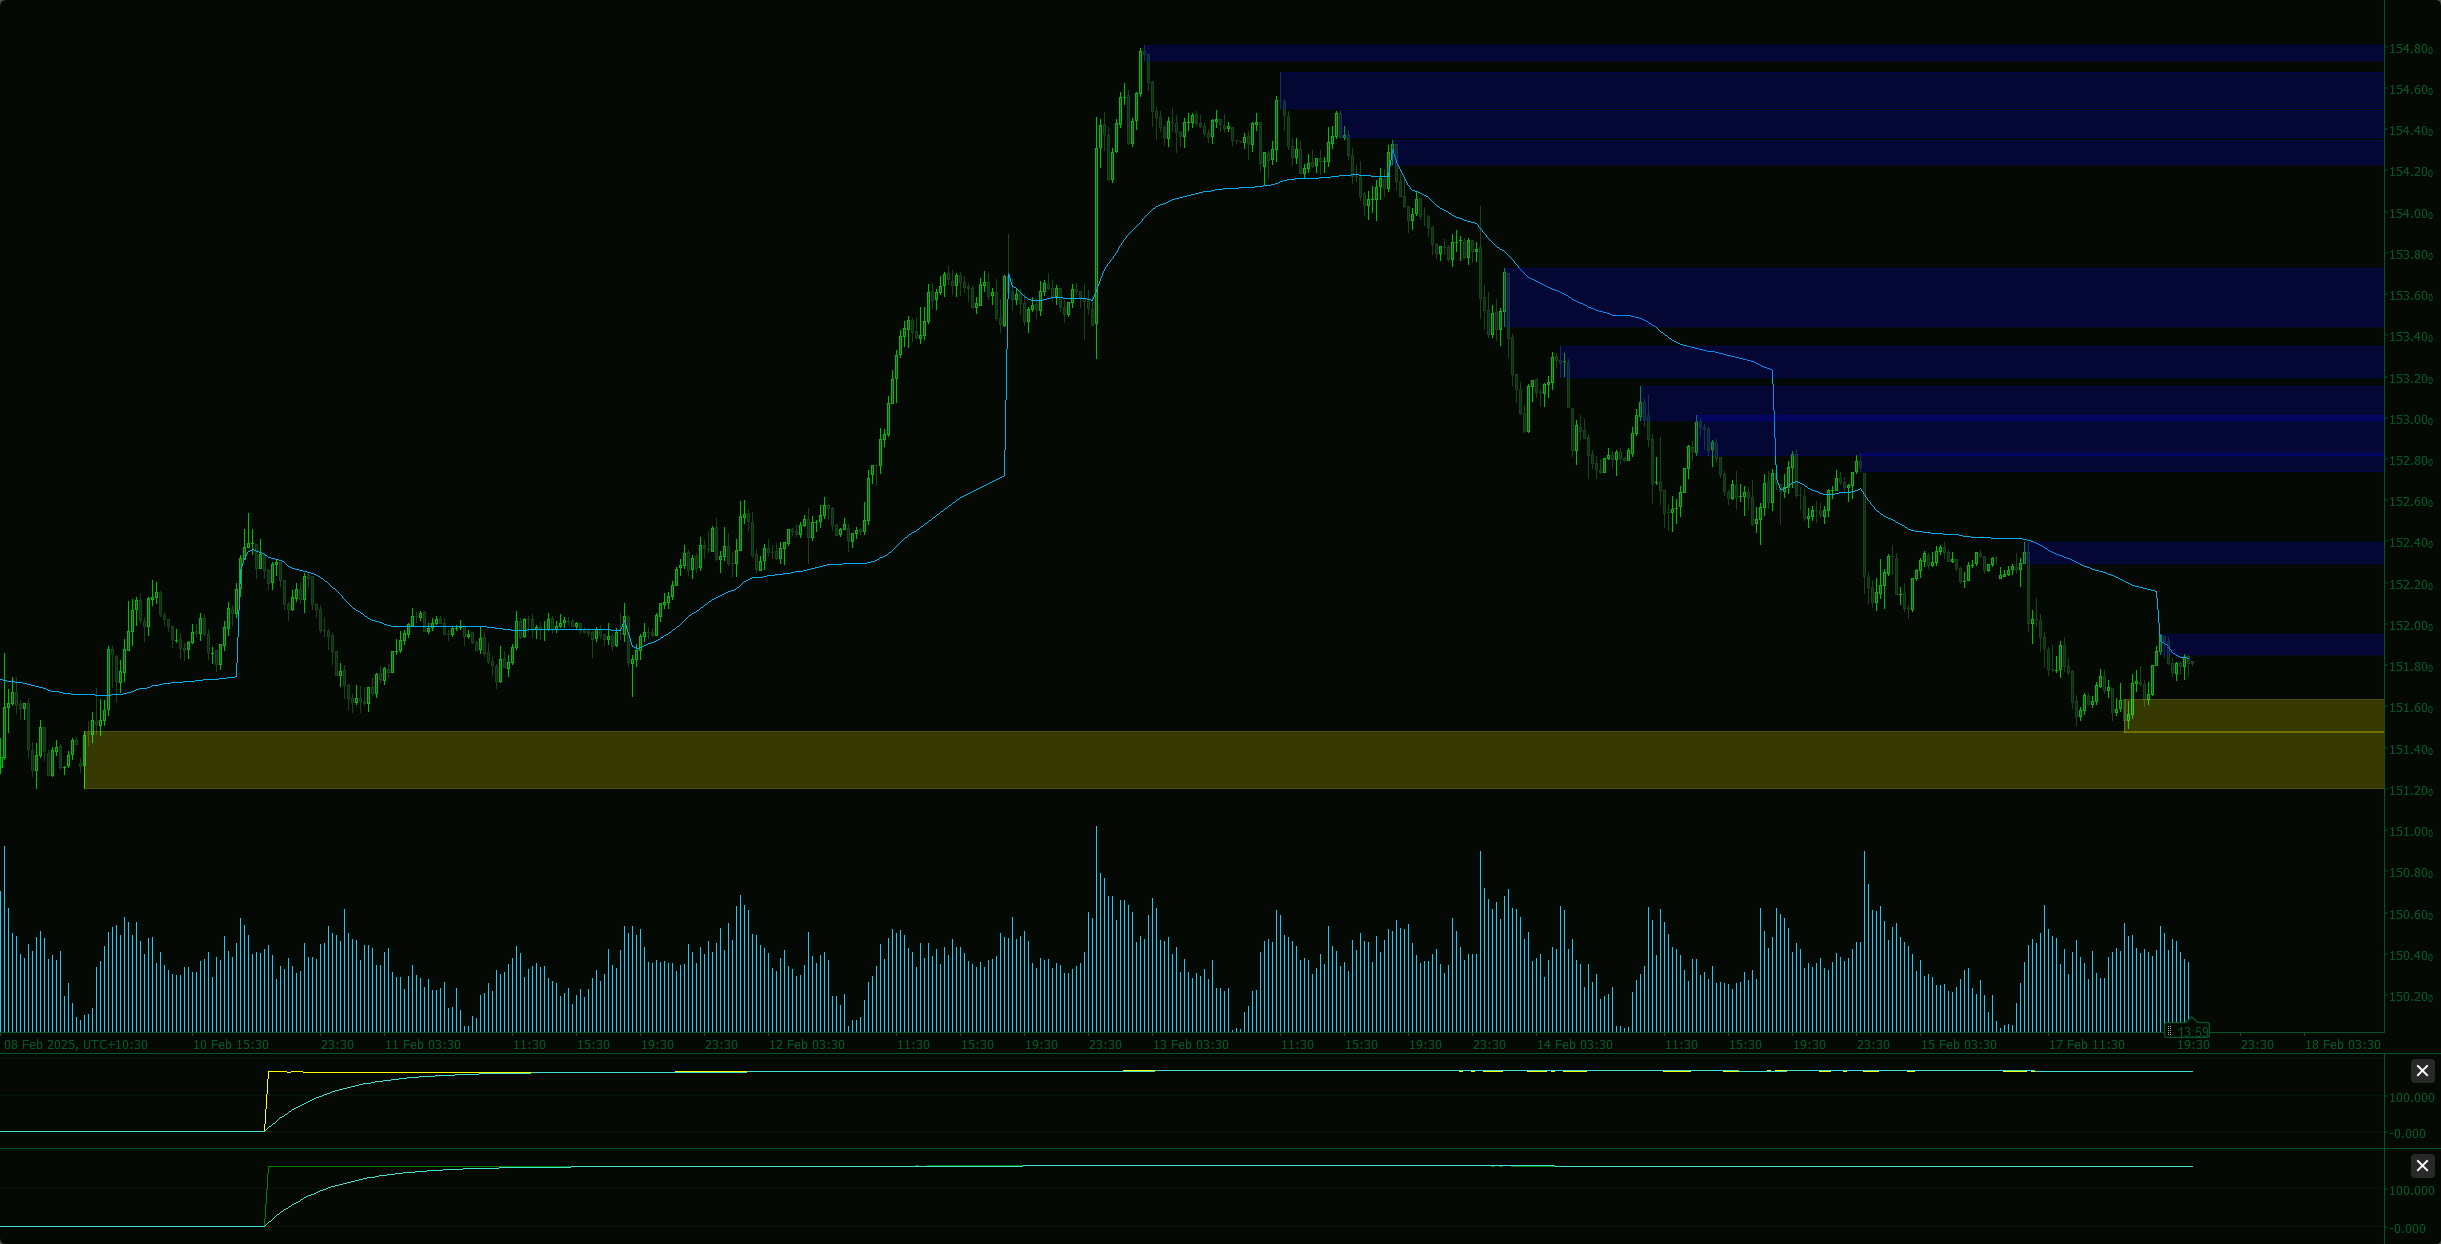
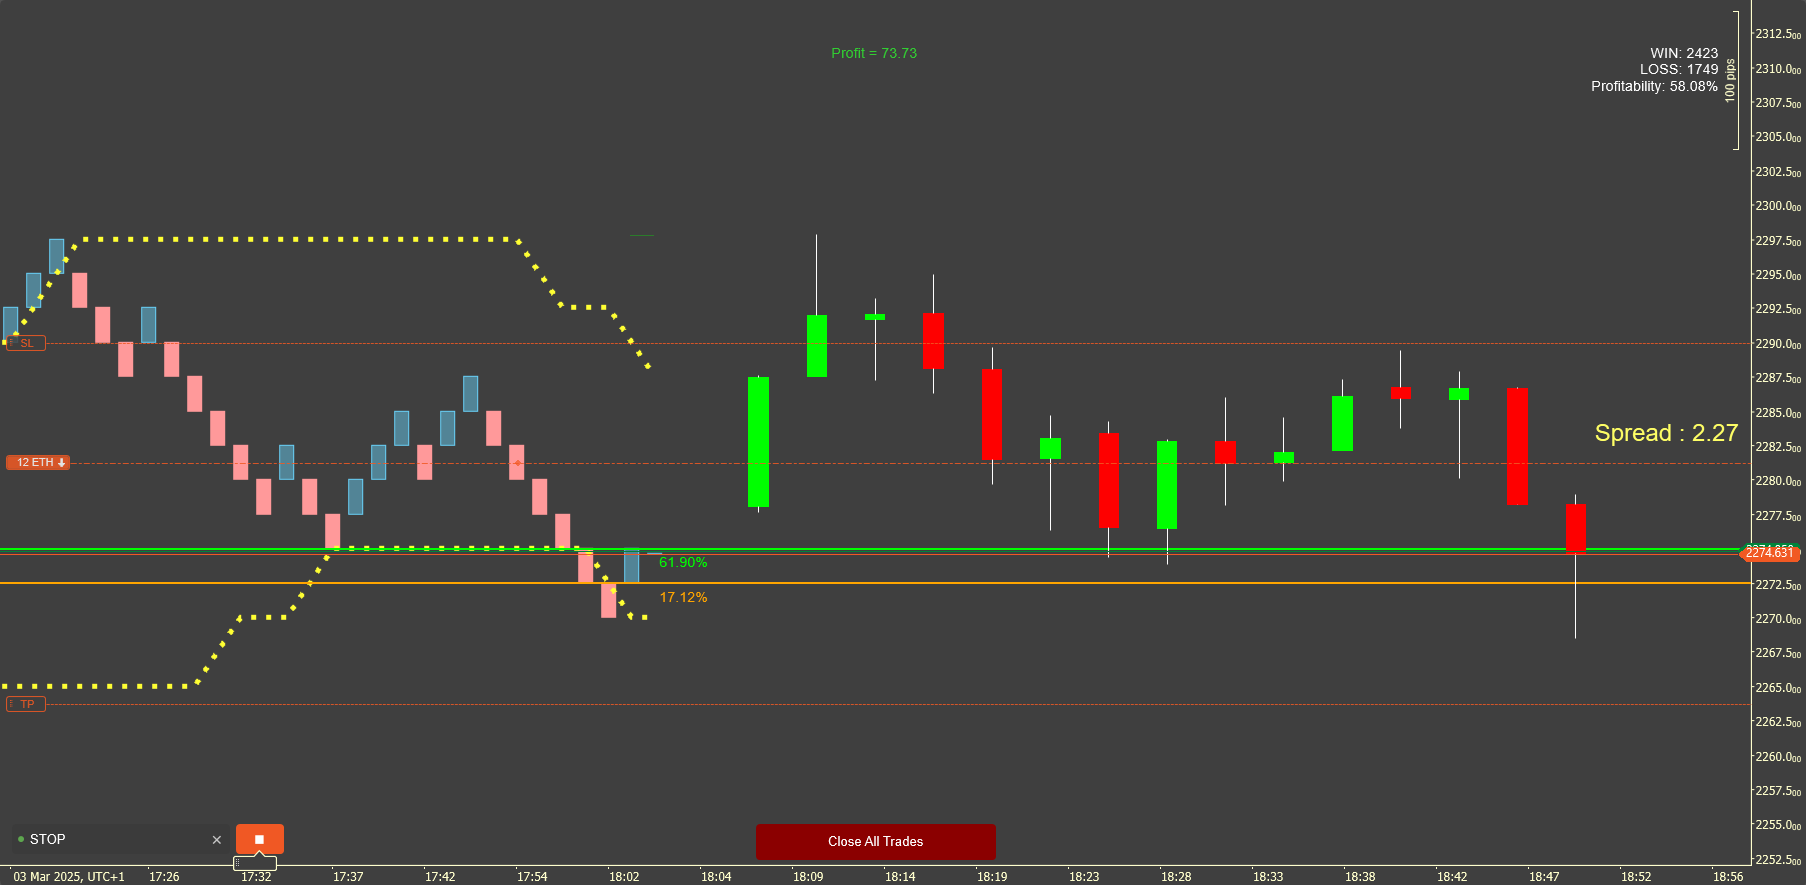
"IVB 2.0" logo
IVB 2.0
0.0
30/08/2025
0
Desktop
"IVB 2.0" uploaded image"IVB 2.0" uploaded image"IVB 2.0" uploaded image
You may also like
Phoenix Zones
Phoenix Zones - Detector de Reversiones Críticas
Indicator
bollinger
Repiptor BB Width
Bollinger Bands Width
Indicator
forex
indices
vwap
+1
vwap
Custom VWAP Indicator for cTrader
Supply Demand - BasicV1
Supply and demand zones. They're important. Here's a free version to get you started!
Indicator
breakout
btcusd
supertrend
+6
PREMIUM SSL CHANNEL
SSL Channel: Tracks trends 📈 measures volatility ⚡filters noise via ATR+SSL. Clear signals for precise entries/exit...
Indicator
breakout
bollinger
RT Bollinger Bands Cloud
Visualize Bollinger Bands with a colored cloud for clarity. Enhance your trading precision with this dynamic indicator!
Indicator
forex
breakout
btcusd
+2
McDonalds Pattern-Bzier Curve
Designed to identify and visualize price reversal patterns using Bézier curves.
Indicator
commodities
xauusd
FVG_tidypips
A Fair Value Gap (FVG) indicator that identifies potential price imbalances, potential reversal and continuation zones
MTF Candles
Multi Timeframe Candle drawing. Draw Any candles from any timeframe on your chart :-)
VegaXLR - cTrader Pitchfork & Channel Enhancer
Enhance Pitchfork & Price Channels in cTrader with customizable Equidistant and Fibonacci levels.
Indicator
forex
bollinger
indices
+3
ScalpingSignals9000
High-probability trading signals in the fast-paced world of forex and CFD trading.
Indicator
forex
indices
rsi
+3
Advanced RSI Indicator
Advanced RSI Indicator with multi-MA smoothing, Bollinger Bands, divergence detection, and fill zones for cTrader.
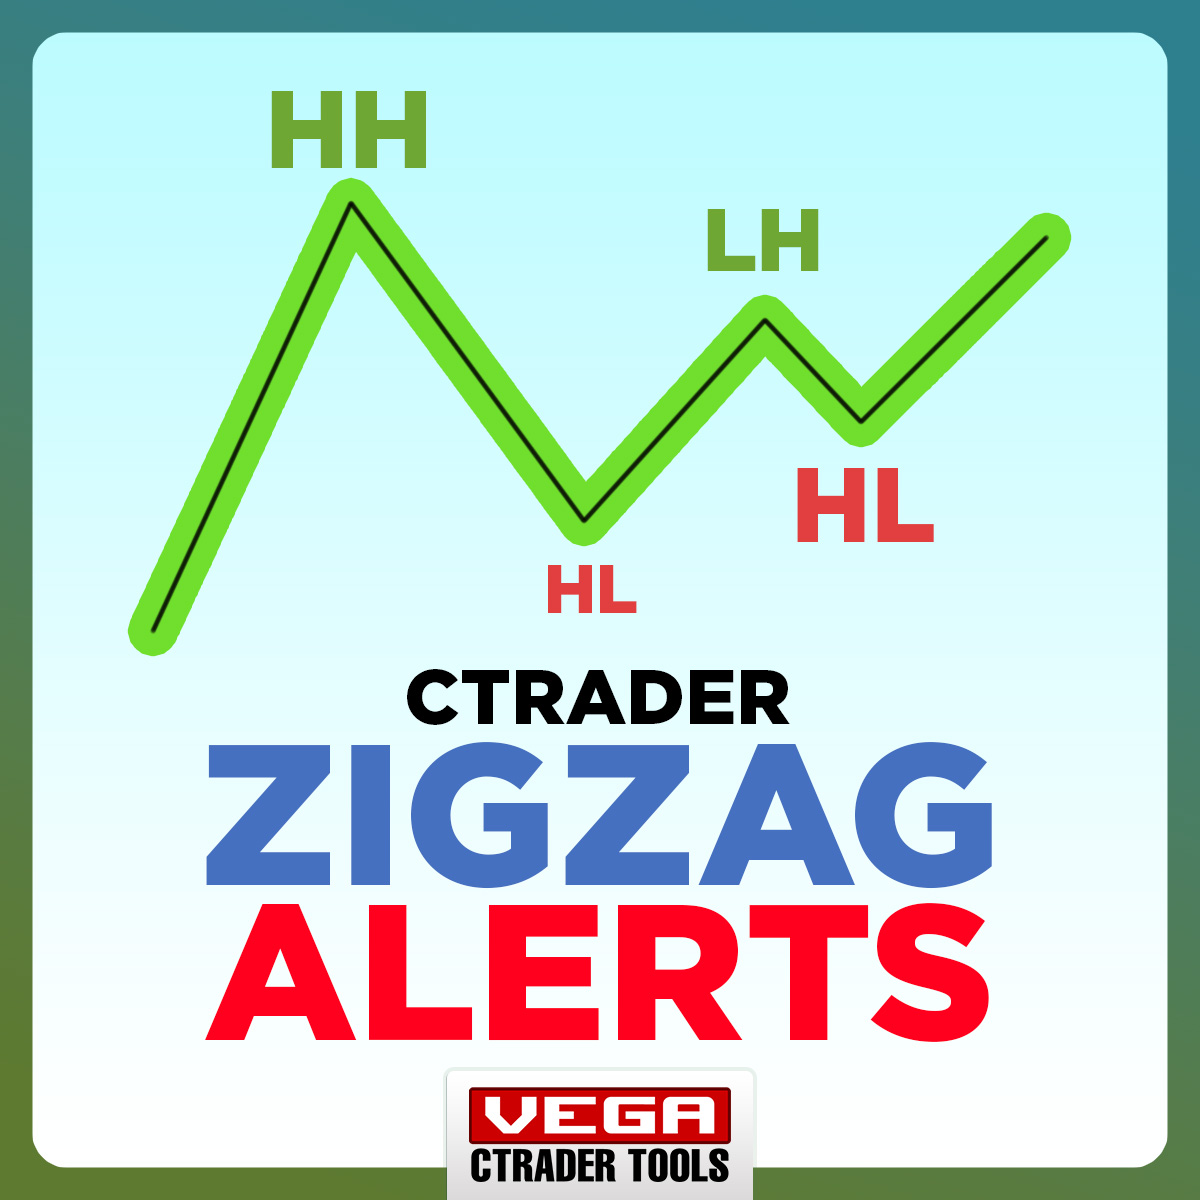
VegaXLR - ZigZag Alerts
cTrader ZigZag Alerts: Precision Swing Detection, Alerts, and Fibonacci.
smma tel
Wstęgi HTS 33 144 mobile
Daily SD Levels - Indicator
Plots intraday VWAP and dynamic ±1/±2 standard deviation (SD) bands based on current day’s price and volume.
RangeBoxLevel
This technical analysis indicator provides information on market sentiment, trend and price levels....
Indicator
forex
indices
gbpusd
+12
Footprint Chart_noSourceCode
"Footprint Chart: Visualize bid-ask volume inside candles for clearer order flow and market depth insights."
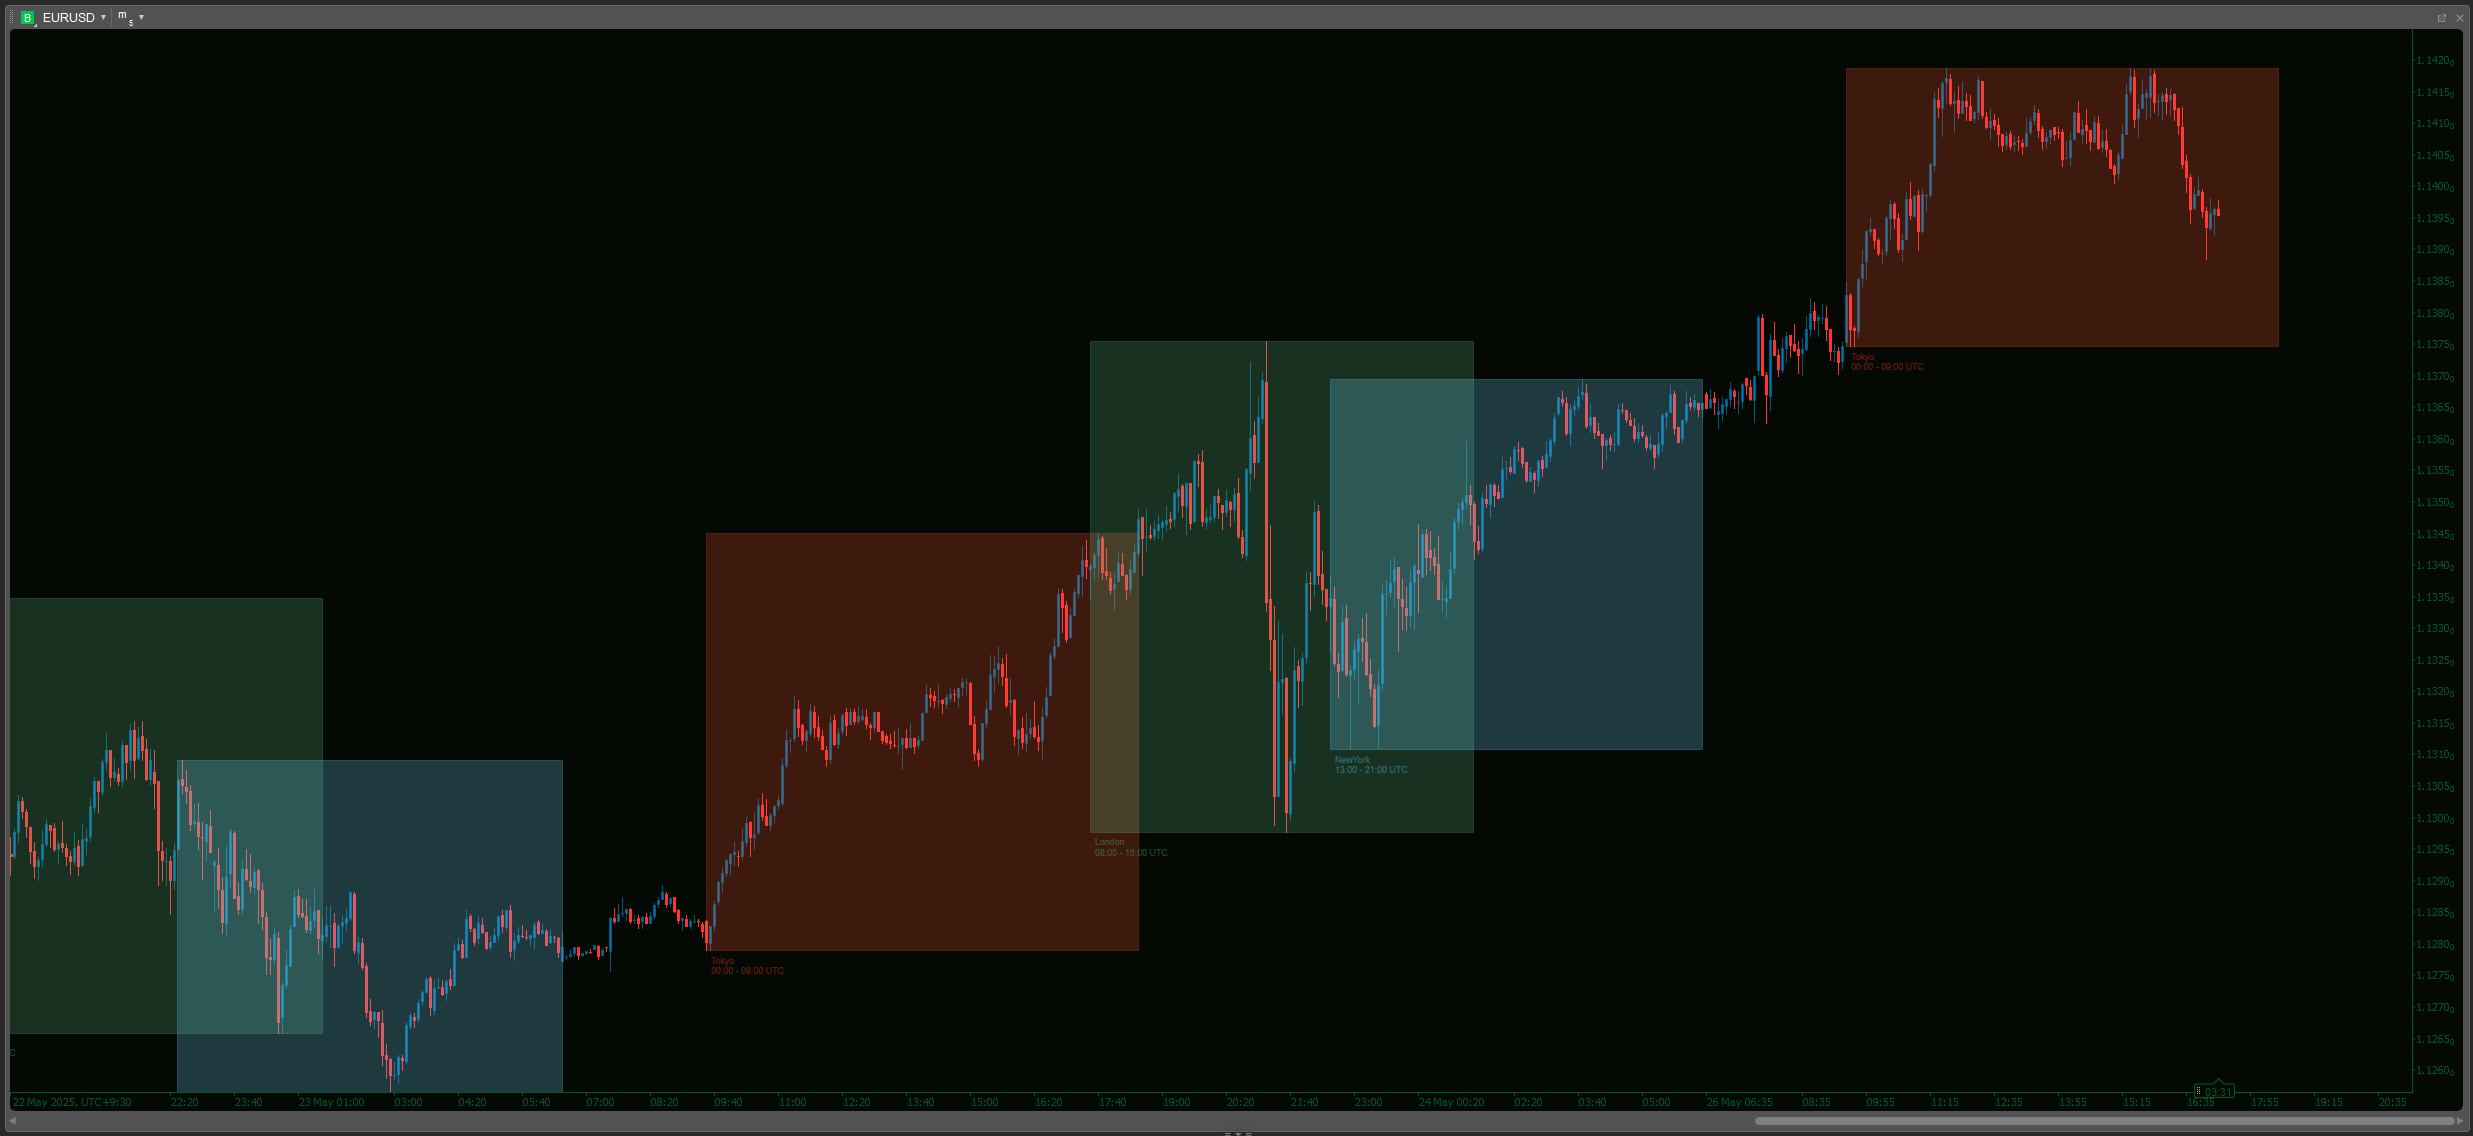
Market Sessions V2_NSC
Market Session V2: Full Control. colors, history, session/text toggles, font size. Elevate your strategy!