Indicator
Grid
Breakout
XAUUSD
Commodities
Forex
Signal
MACD
Indices
Prop
ATR
Stocks
Crypto
Scalping
Ultimate Trend ADX
"Ultimate Trend ADX" logo
02/10/2025
Desktop
Since 13/09/2025
Free installs
102
"Ultimate Trend ADX" uploaded image"Ultimate Trend ADX" uploaded image"Ultimate Trend ADX" uploaded image"Ultimate Trend ADX" uploaded image"Ultimate Trend ADX" uploaded image

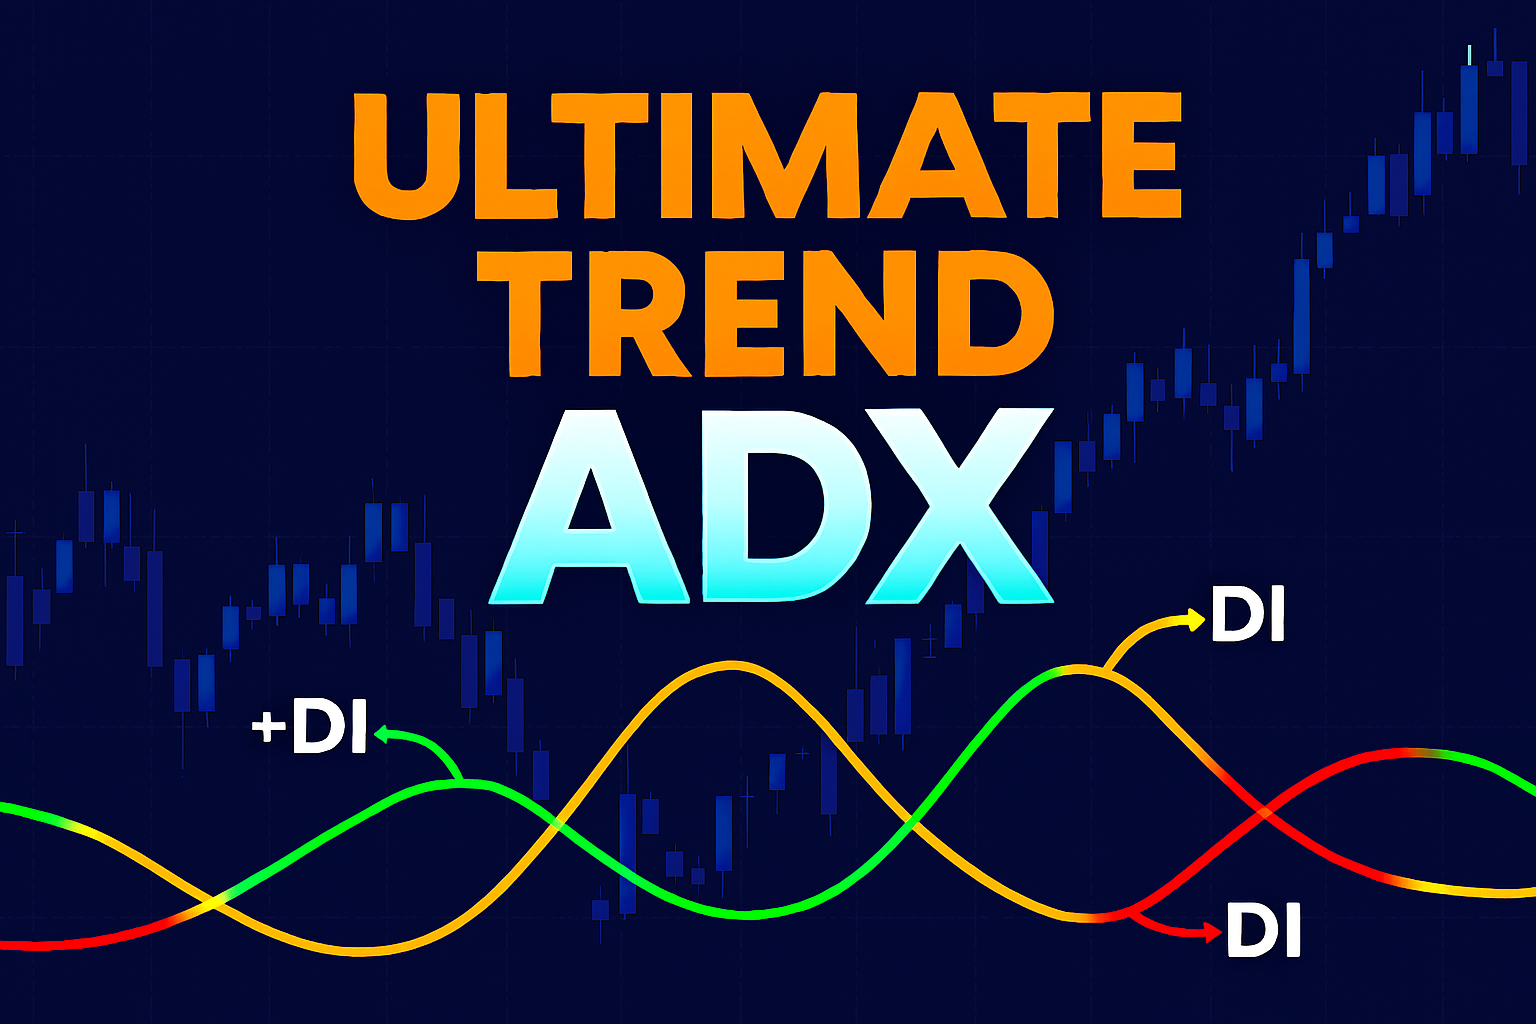
Ultimate Trend ADX is a powerful and refined version of the classic Average Directional Index (ADX), designed to give traders a clearer, more dynamic view of market trends and momentum. Unlike the standard ADX, this enhanced tool applies advanced smoothing techniques (EMA or KAMA) and introduces scaling options to make the indicator lines more responsive and visually impactful. The result is a professional‑grade indicator that helps you identify strong trends, spot reversals, and confirm entries with greater confidence.


How to Read the Indicator

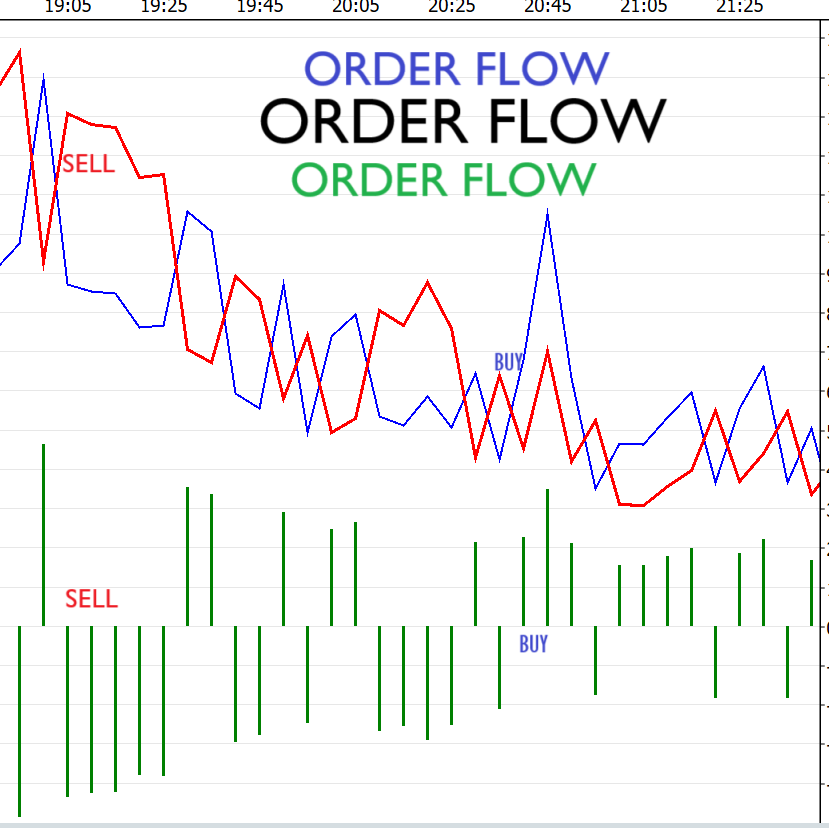
Ultimate Trend ADX displays three key lines in a separate window beneath your chart:


ADX Line (Blue/Yellow): Measures the overall strength of the trend. A rising ADX indicates a strengthening trend, while a falling ADX suggests weakening momentum. Values above 25 typically signal a strong trend.


+DI Line (Green): Represents bullish directional movement. When +DI is above –DI, buyers are in control.


–DI Line (Red): Represents bearish directional movement. When –DI is above +DI, sellers dominate the market.


Reading the signals is straightforward:


When +DI crosses above –DI and ADX is rising, it suggests a strong bullish trend.


When –DI crosses above +DI and ADX is rising, it signals a strong bearish trend.


When ADX is below 20–25, the market is usually ranging or lacking clear direction.


The indicator also includes horizontal levels at 0, 25, 50, 75, and 100 to help you quickly gauge the intensity of the trend.


How the Indicator Works

The Ultimate Trend ADX is built on the standard Directional Movement System but enhanced with modern smoothing algorithms:


Exponential Moving Average (EMA): Provides a fast, responsive smoothing option for traders who want to capture short‑term momentum.


Kaufman’s Adaptive Moving Average (KAMA): Adjusts dynamically to market volatility, filtering out noise during sideways conditions while remaining sensitive during strong trends.


Scaling Factor for +DI and –DI: Amplifies the green and red lines, making bullish and bearish signals more visible and easier to interpret on the chart.


This combination ensures that the indicator adapts to different market environments, giving you both clarity and precision.


Key Features

Enhanced ADX Calculation – Uses EMA or KAMA smoothing for more accurate and adaptive trend strength measurement.


Clear Visual Signals – Distinct color coding (blue/yellow for ADX, green for +DI, red for –DI) makes interpretation intuitive.


Adjustable Sensitivity – Parameters allow you to fine‑tune responsiveness to match your trading style.


Built‑in Horizontal Levels – Quick reference levels (0/25/50/75/100) help you instantly assess trend intensity.


Why Choose Ultimate Trend ADX?


Trading success often depends on identifying when a market is trending and when it is not. The Ultimate Trend ADX gives you that edge by combining the reliability of the classic ADX with modern enhancements that make it sharper, clearer, and more actionable. Whether you trade forex, stocks, indices, or commodities, this indicator will help you filter out noise, confirm signals, and stay aligned with the prevailing market direction.


More from this author
Indicator
Grid
XAUUSD
Forex
+3
Daily Open Color Zones
indicator showing the Daily Open Line and instantly shading bullish and bearish zones.
Indicator
Grid
XAUUSD
ATR
+5
Trend Scope pro
Trend Scope Pro – Smarter Trend Analysis with Linear Regression Channels
Indicator
XAUUSD
Breakout
Forex
+4
Market Bias Gauge
Measure Market Strength at a Glance – Instantly
Indicator
XAUUSD
Breakout
Stocks
+6
Final Moving Average
Final Moving Average is an adaptive system designed to keep traders aligned with the true direction of the market
Indicator
Grid
Martingale
Signal
+2
Trend Pulse X
is a trend-following indicator designed to provide a clear view of market direction, momentum, and strength
cBot
XAUUSD
Breakout
Commodities
+3
Gold Pulse Pro
Gold Pulse Pro – An automated trading system for gold (XAUUSD) precisely engineered and powered by advanced algorithms
Indicator
RSI
XAUUSD
ATR
+3
RSI NextGen
The RSI NextGen is an advanced and modernized version of the classic Relative Strength Index (RSI)
Indicator
XAUUSD
Commodities
Forex
+5
BullBear Dynamics
BullBear Dynamics helps traders detect and interpret the balance between bullish and bearish momentum
Indicator
Grid
RSI
Breakout
+6
Final Stochastic Oscillator
Final Stochastic Oscillator is a next-generation upgrade of the classic stochastic indicator
Indicator
Grid
RSI
ATR
+6
PFO Price Flow Oscillator
technical analysis tool designed to provide traders with a structured view of market momentum and volatility
You may also like
Auto Fibonacci Retracement
Auto Fibonacci Retracement Indicator for cTrader
Order Flow
Volumen Delta", es una representación visual del flujo de órdenes basada en el volumen de transacciones.
Indicator
NAS100
RSI
NZDUSD
+15
HAIQuantum_TheGame
This trading game allows you to explore and practice investment strategies in a real-time market data environment.
Indicator
Grid
Indices
Breakout
+8
TSPivotSMC
Pivot Point MultiTimeFrame with Order Block
Rsi buy Sell Signal
Instant‑setup RSI scalper—designed for turbulent markets.
Goldenhours
The Session Golden Hours indicator is designed for serious traders looking to visualize high-probability
FVG
The Indicator is a powerful tool for price-action traders seeking to identify and exploit short-term imbalances.
Vishal Volume Profile v2.0
Volume Profile plots traded volume at each price level, highlighting high activity zones of precise support & resistance
Indicator
RSI
Breakout
Supertrend
+1
Momentum Fair Value Gap
It identifies areas of market imbalance (Fair Value Gaps or FVGs) and projects them on the chart in a smart way
Indicator
Bollinger
E7 Indicators Free Overlays
Bollinger Band Cloud, Heiken Ashi, Trend Follower and Parabolic SAR.
Pattern Signal Forex
Indicator pattern signal moment
Indicator
VWAP
ZigZag
RSI
+6
RSI T3 overbought and oversold area
ZigZag Price Liquidity Projection
📊 ZigZag Liquidity Projection: Predict bounces/breaks using pivots, ATR & volume.
Indicator
Breakout
Fx4U.Multi TimeFrame Support & Resistance
Allow trader to visualize Support & Resistance across different timeframes,give trader an overview of the current market
Reko Wic
Visualize global Forex trading sessions with clear time blocks for better timing and strategy planning.
Indicator
Indices
Stocks
Forex
+4
MACD Pro Trader
🚀 MACD Pro Trader – Advanced MACD with buy/sell signals, custom MAs & color-coded histograms for smarter trading! 📈🔥
Indicator
Indices
AI
Machine Learning Momentum Index
The Machine Learning Momentum Index (MLMI) represents the next step in oscillator trading.
Indicator
Bollinger
BB Width
Indicatore di volatilità che filtra quando le bande di Bollinger sono in espansione