Brokers & props
For business
00
Days
:
00
Hours
:
00
Minutes
:
00
Seconds
Trend Scope pro
Indicator
Version 1.0, Sep 2025
Windows, Mac
5.0
Reviews: 1
Since 13/09/2025
Sales
17
Free installs
2821
"Trend Scope pro" uploaded image"Trend Scope pro" uploaded image"Trend Scope pro" uploaded image"Trend Scope pro" uploaded image"Trend Scope pro" uploaded image

Trend Scope Pro is a professional-grade technical indicator designed to give traders a deeper understanding of market structure and price direction. Built on advanced linear regression algorithms, this tool calculates a dynamic regression line along with three levels of standard deviation channels. By combining statistical accuracy with visual clarity, it helps you identify current market trends, potential reversal zones, and volatility ranges with ease. making it an accessible yet powerful addition to any trading toolkit.


How to Read Trend Scope Pro


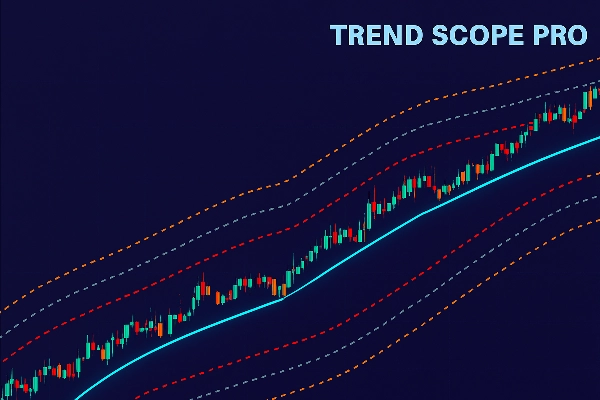
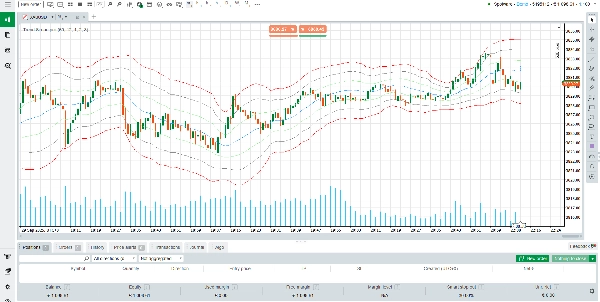
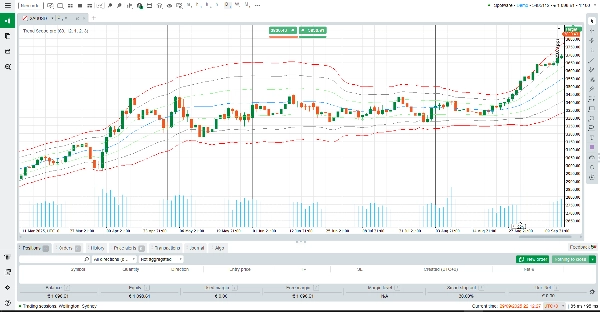
When applied to your chart, Trend Scope Pro draws a central regression line (blue), which represents the “fair value” or average trend direction over a defined period. Around this line, three sets of upper and lower channels are plotted (orange, gray, and red). Each channel is calculated using a different standard deviation multiplier:


Upper/Lower 1 (Orange): Represents the first standard deviation. Price movements within this zone often reflect normal short-term volatility.


Upper/Lower 2 (Gray): Marks stronger deviations. Reaching this zone often signals an extended move or developing momentum.


Upper/Lower 3 (Red): Extreme zones where the market may be overbought or oversold, creating potential reversal opportunities.


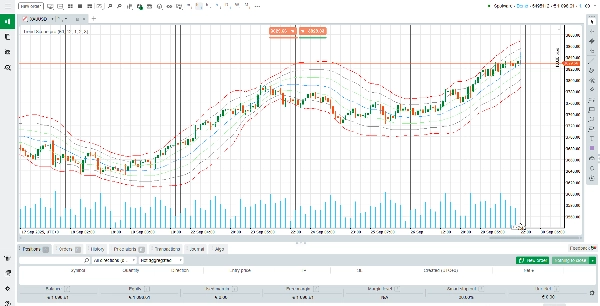
In practice, traders can use the regression line to confirm trend direction, while the channels act as dynamic support and resistance levels. For example:


If price consistently stays above the regression line, the trend is bullish.


If price repeatedly tests or breaks below the regression line, the trend is weakening.


Extreme touches at the red channels may highlight exhaustion points, where reversals or pullbacks are more likely.


How the Indicator Works


Trend Scope Pro calculates a regression line by analyzing the closing prices over a chosen lookback period. It then measures the standard deviation of price from this line, which determines the width of each channel. This statistical approach ensures the indicator adapts to real-time volatility, providing a balance between trend-following signals and mean-reversion insights.


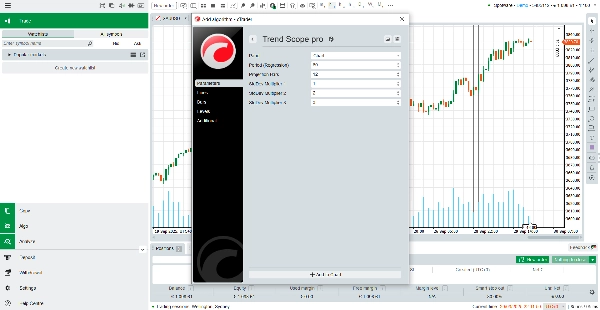
The default settings (60 bars lookback, multipliers 1.0, 2.0, 3.0) are optimized for most instruments, but you can easily adjust them to fit your strategy or timeframe. Whether you are a day trader looking for intraday entries, or a swing trader analyzing broader market cycles, Trend Scope Pro delivers reliable context for decision-making.


Key Features of Trend Scope Pro


Adaptive Linear Regression – Calculates the central market trend dynamically for precise directional bias.


Multi-Level Channels – Three sets of deviation bands help identify normal moves, strong trends, and extreme conditions.


Visual Clarity – Clean and color-coded lines make it easy to interpret price action at a glance.


Customizable Settings – Flexible lookback periods and deviation multipliers to match any trading style.


In summary, Trend Scope Pro combines statistical reliability with practical usability. It’s more than just a trendline—it’s a complete framework for analyzing price behavior, identifying high-probability zones, and improving trade timing. Whether you’re seeking confirmation of the trend, anticipating reversals, or simply adding structure to your charts, Trend Scope Pro offers the clarity and confidence you need.

5.0
Reviews: 1
5
100 %
4
0 %
3
0 %
2
0 %
1
0 %
Customer reviews
October 22, 2025
Stay in the flow 🚀 - Trend Scope Pro spots trend phases early and keeps you aligned with the market’s rhythm. Smooth, accurate, and trader-friendly!
Grid
XAUUSD
ATR
Commodities
Forex
MACD
Crypto
Scalping

More from this author

cBot
RSI
Breakout
XAUUSD
+14
Super trend X
SuperTrend X cBot is a fully automated trading robot for cTrader built entirely on the power of the SuperTrend indicator
Indicator
XAUUSD
Breakout
Stocks
+6
Signal Strike
Signal Strike is a professional trading indicator delivers clear, high‑confidence entry signals directly on your chart
Indicator
RSI
Breakout
XAUUSD
+12
Stop Loss Professional
Stop Loss Pro – Precision Risk Management for Every Trader
cBot
Breakout
XAUUSD
Commodities
+3
Gold Pulse Pro
Gold Pulse Pro – An automated trading system for gold (XAUUSD) precisely engineered and powered by advanced algorithms
cBot
RSI
XAUUSD
Commodities
+11
Strategy EMA 21
EMA 21 13 8 Scalper is a fully automated trading system that captures intraday momentum with clarity and discipline
Indicator
XAUUSD
Commodities
Forex
+10
Perfect Entry Price
Perfect Entry Price designed to help traders identify the most accurate and reliable price levels for market entries
Indicator
Grid
XAUUSD
Forex
+3
Daily Open Color Zones
indicator showing the Daily Open Line and instantly shading bullish and bearish zones.
Indicator
XAUUSD
Breakout
Stocks
+6
Final Moving Average
Final Moving Average is an adaptive system designed to keep traders aligned with the true direction of the market
Indicator
Grid
Breakout
XAUUSD
+10
Ultimate Trend ADX
Download Ultimate Trend ADX today and experience a smarter way to track market trends completely free on ctrader
cBot
RSI
Breakout
XAUUSD
+8
Gold Predict X
Gold Predict AI – Advanced Predictive Trading for XAUUSD (M15)
Indicator
Indices
Breakout
XAUUSD
+9
Market Bias Gauge
Measure Market Strength at a Glance – Instantly
cBot
RSI
Indices
Commodities
+7
Super trend RSI ADX
Supertrend RSI ADX is a trading system built for traders who demand precision, control, and steady performance.

You may also like

MTF Candle Window - On Chart
The Multi-Timeframe Candle Indicator displays candles from multiple timeframes in one window, enhancing market analysis!
Indicator
Indices
XAUUSD
Forex
+3
Three Candle Patterns
Spot powerful 3-candle reversal patterns like Morning/Evening Star and Soldiers/Crows at key swing highs and lows
Bars color 1
This is the first version I offer you for free.
Indicator
Indices
RSI
XAUUSD
+9
RsiMultiFrameOBOS
Multi-Timeframe Trend Dots RSI
Daily SD Levels - Indicator
Plots intraday VWAP and dynamic ±1/±2 standard deviation (SD) bands based on current day’s price and volume.
ms_Candle_ColseTime
⏱ Candle Time Remaining – Real-Time Candle Countdown Indicator
Indicator
Grid
NAS100
RSI
+19
Smart Volume Delta
Detects smart money activity using advanced tick volume and price divergence analysis.
Indicator
Indices
Prop
Stocks
+3
4MA
This indicator consists of 3 moving averages that can be configured to your liking, from the type of moving average....
Indicator
NAS100
NZDUSD
XAUUSD
+8
Squeeze Breakout Regression System
💥Detects moments when the market is "compressed" and about to explode in any direction 💥
Indicator
XAUUSD
Forex
EURUSD
+2
Risk & Reward Trading Tool Pro.v2.15
This is a tool to help traders open orders/close orders/modify orders quickly with just one click
Indicator
Indices
E7 BlackScholes Model
Option pricing using the BlackScholes model and the Math.Numerics packages
Indicator
NAS100
NZDUSD
Martingale
+26
Daily TPO profile
Daily TPO profile indicator that calculates POC, VAH and VAL for each session. Plots the Point of Control and the 70% Va