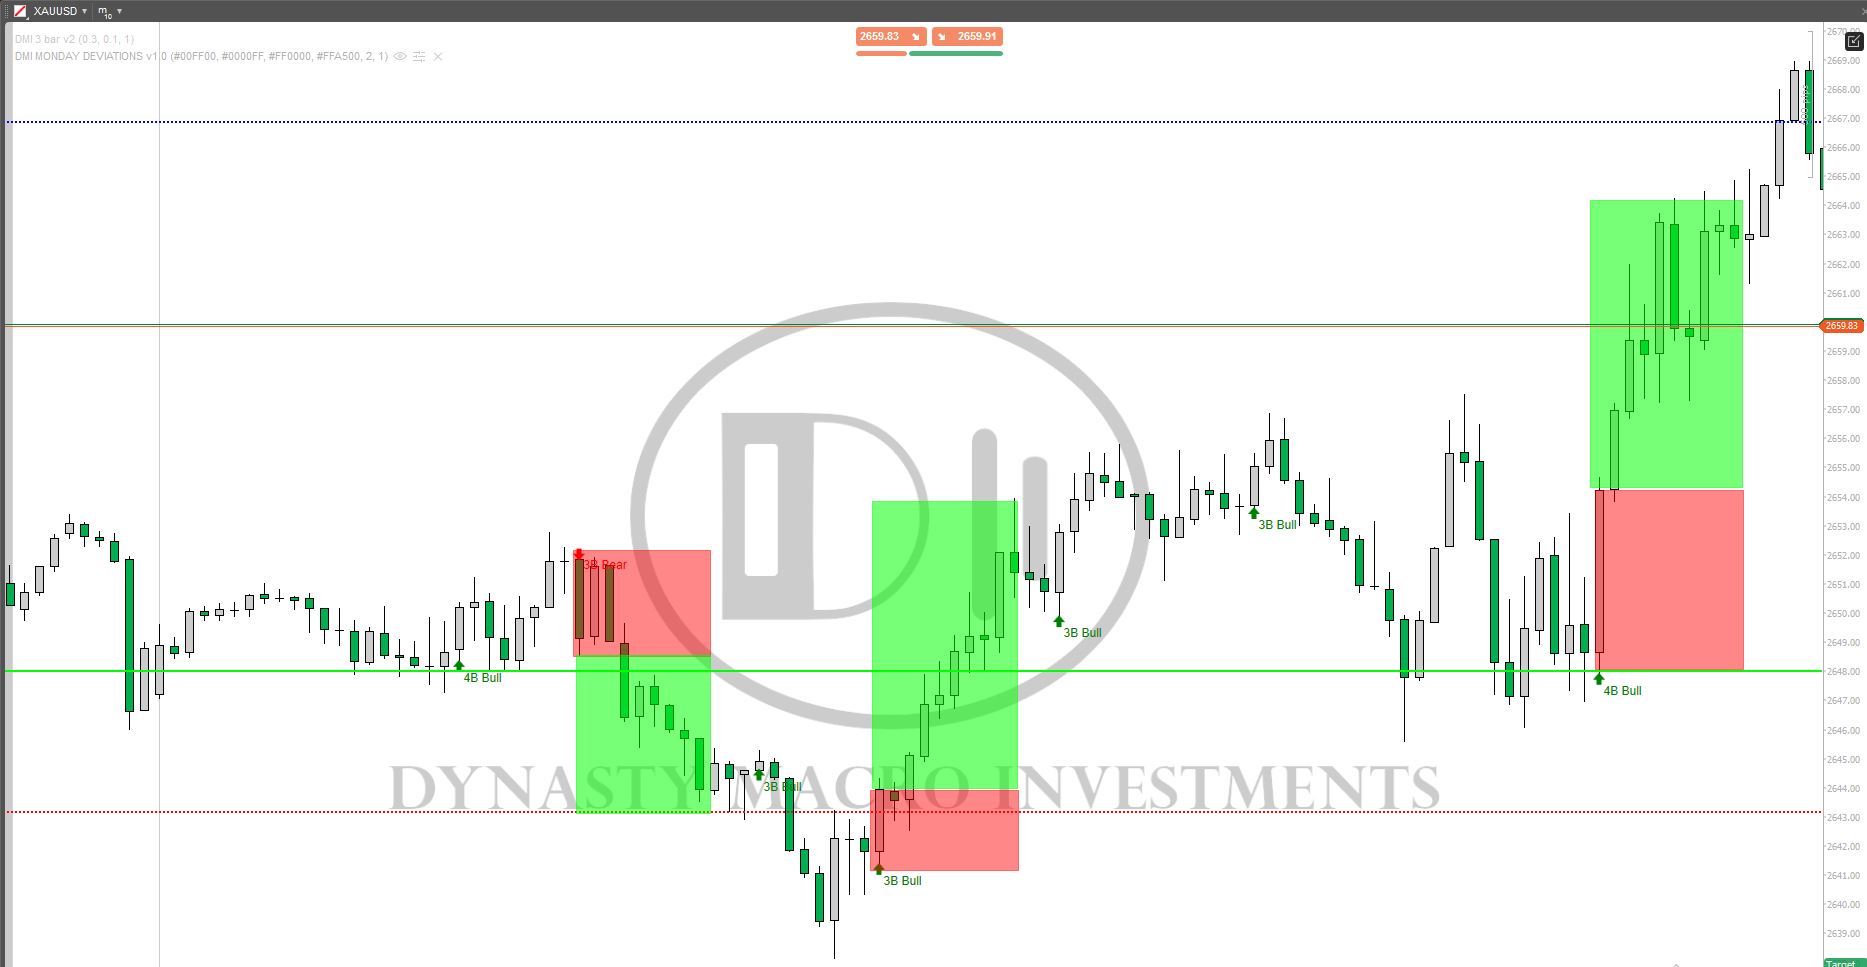
DMI 3 bar v2
"DMI 3 bar v2" logo
03/09/2025
Desktop
Since 11/12/2024
"DMI 3 bar v2" uploaded image

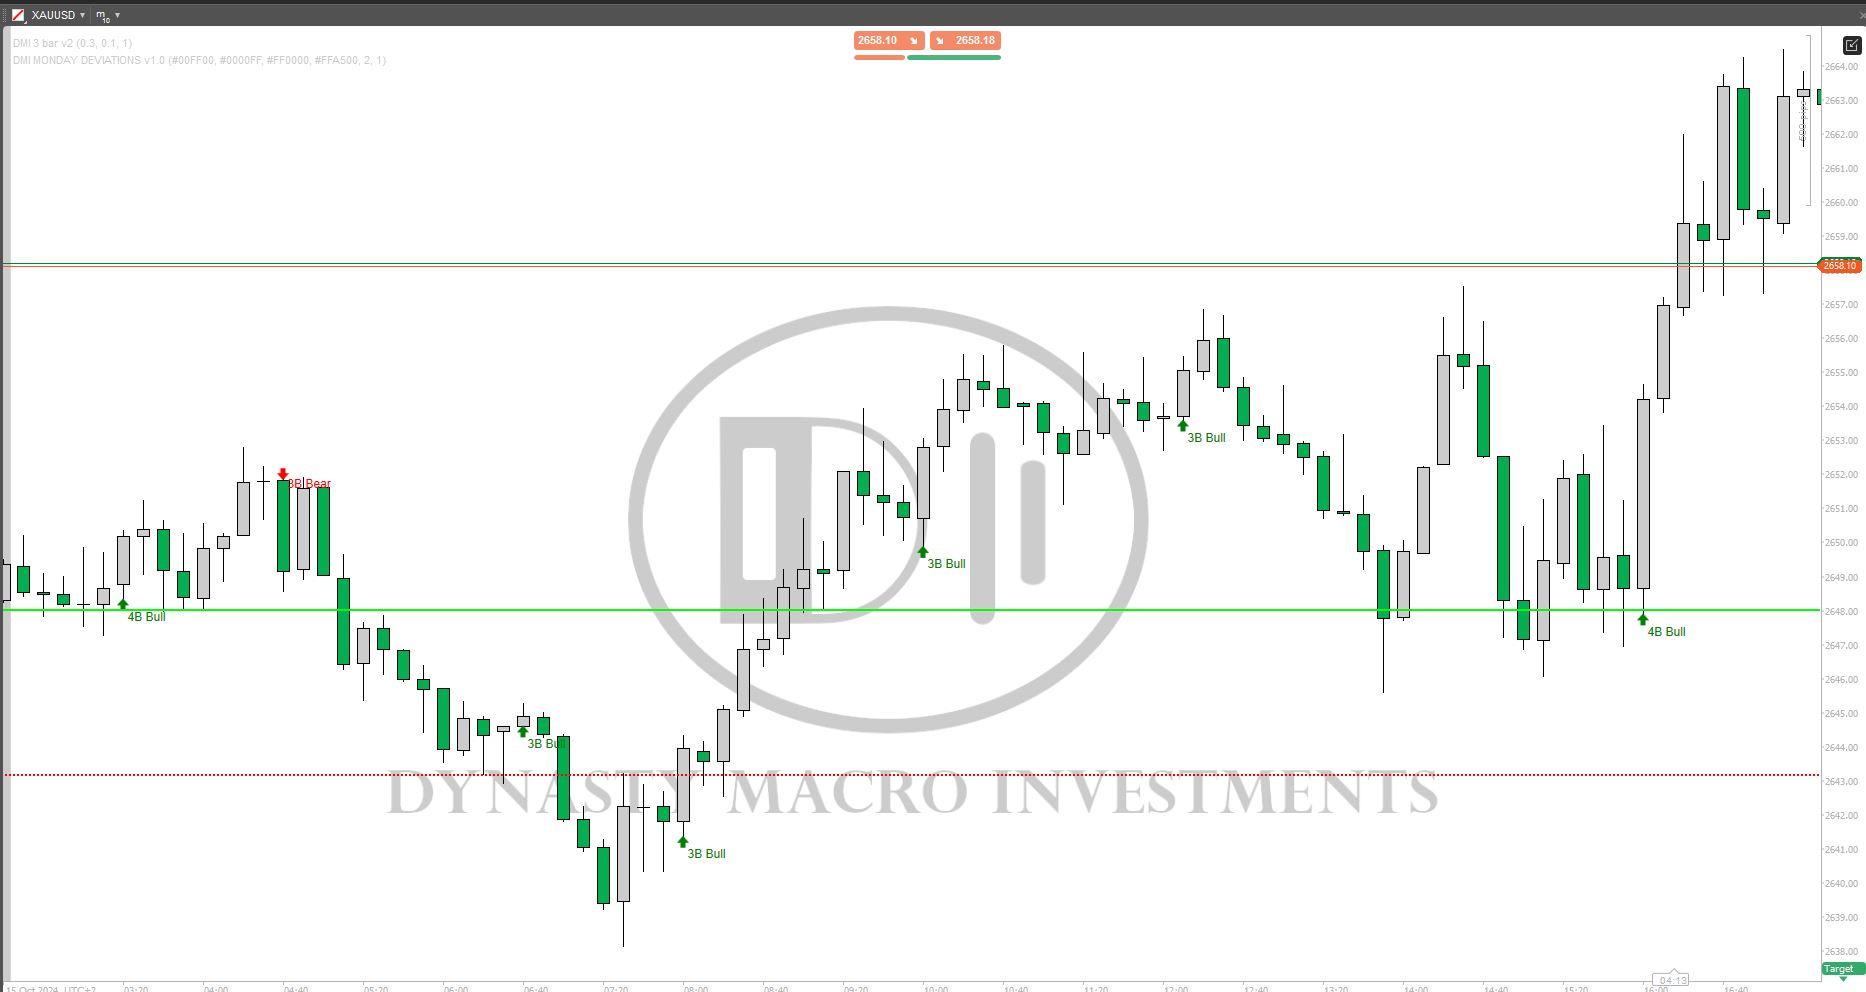
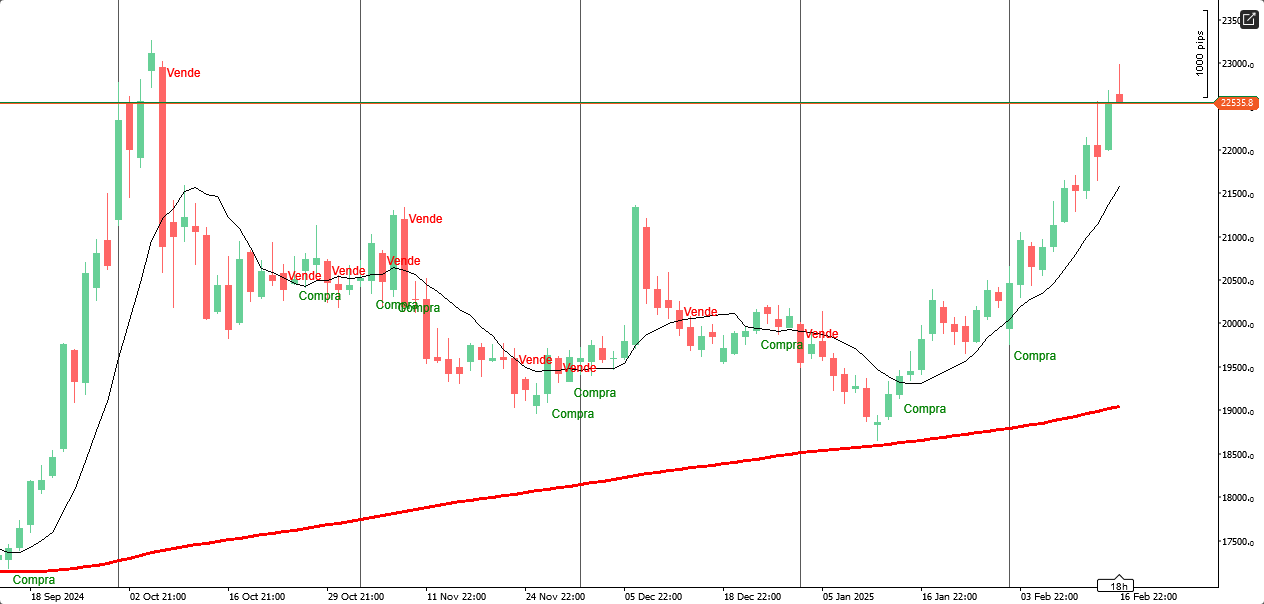
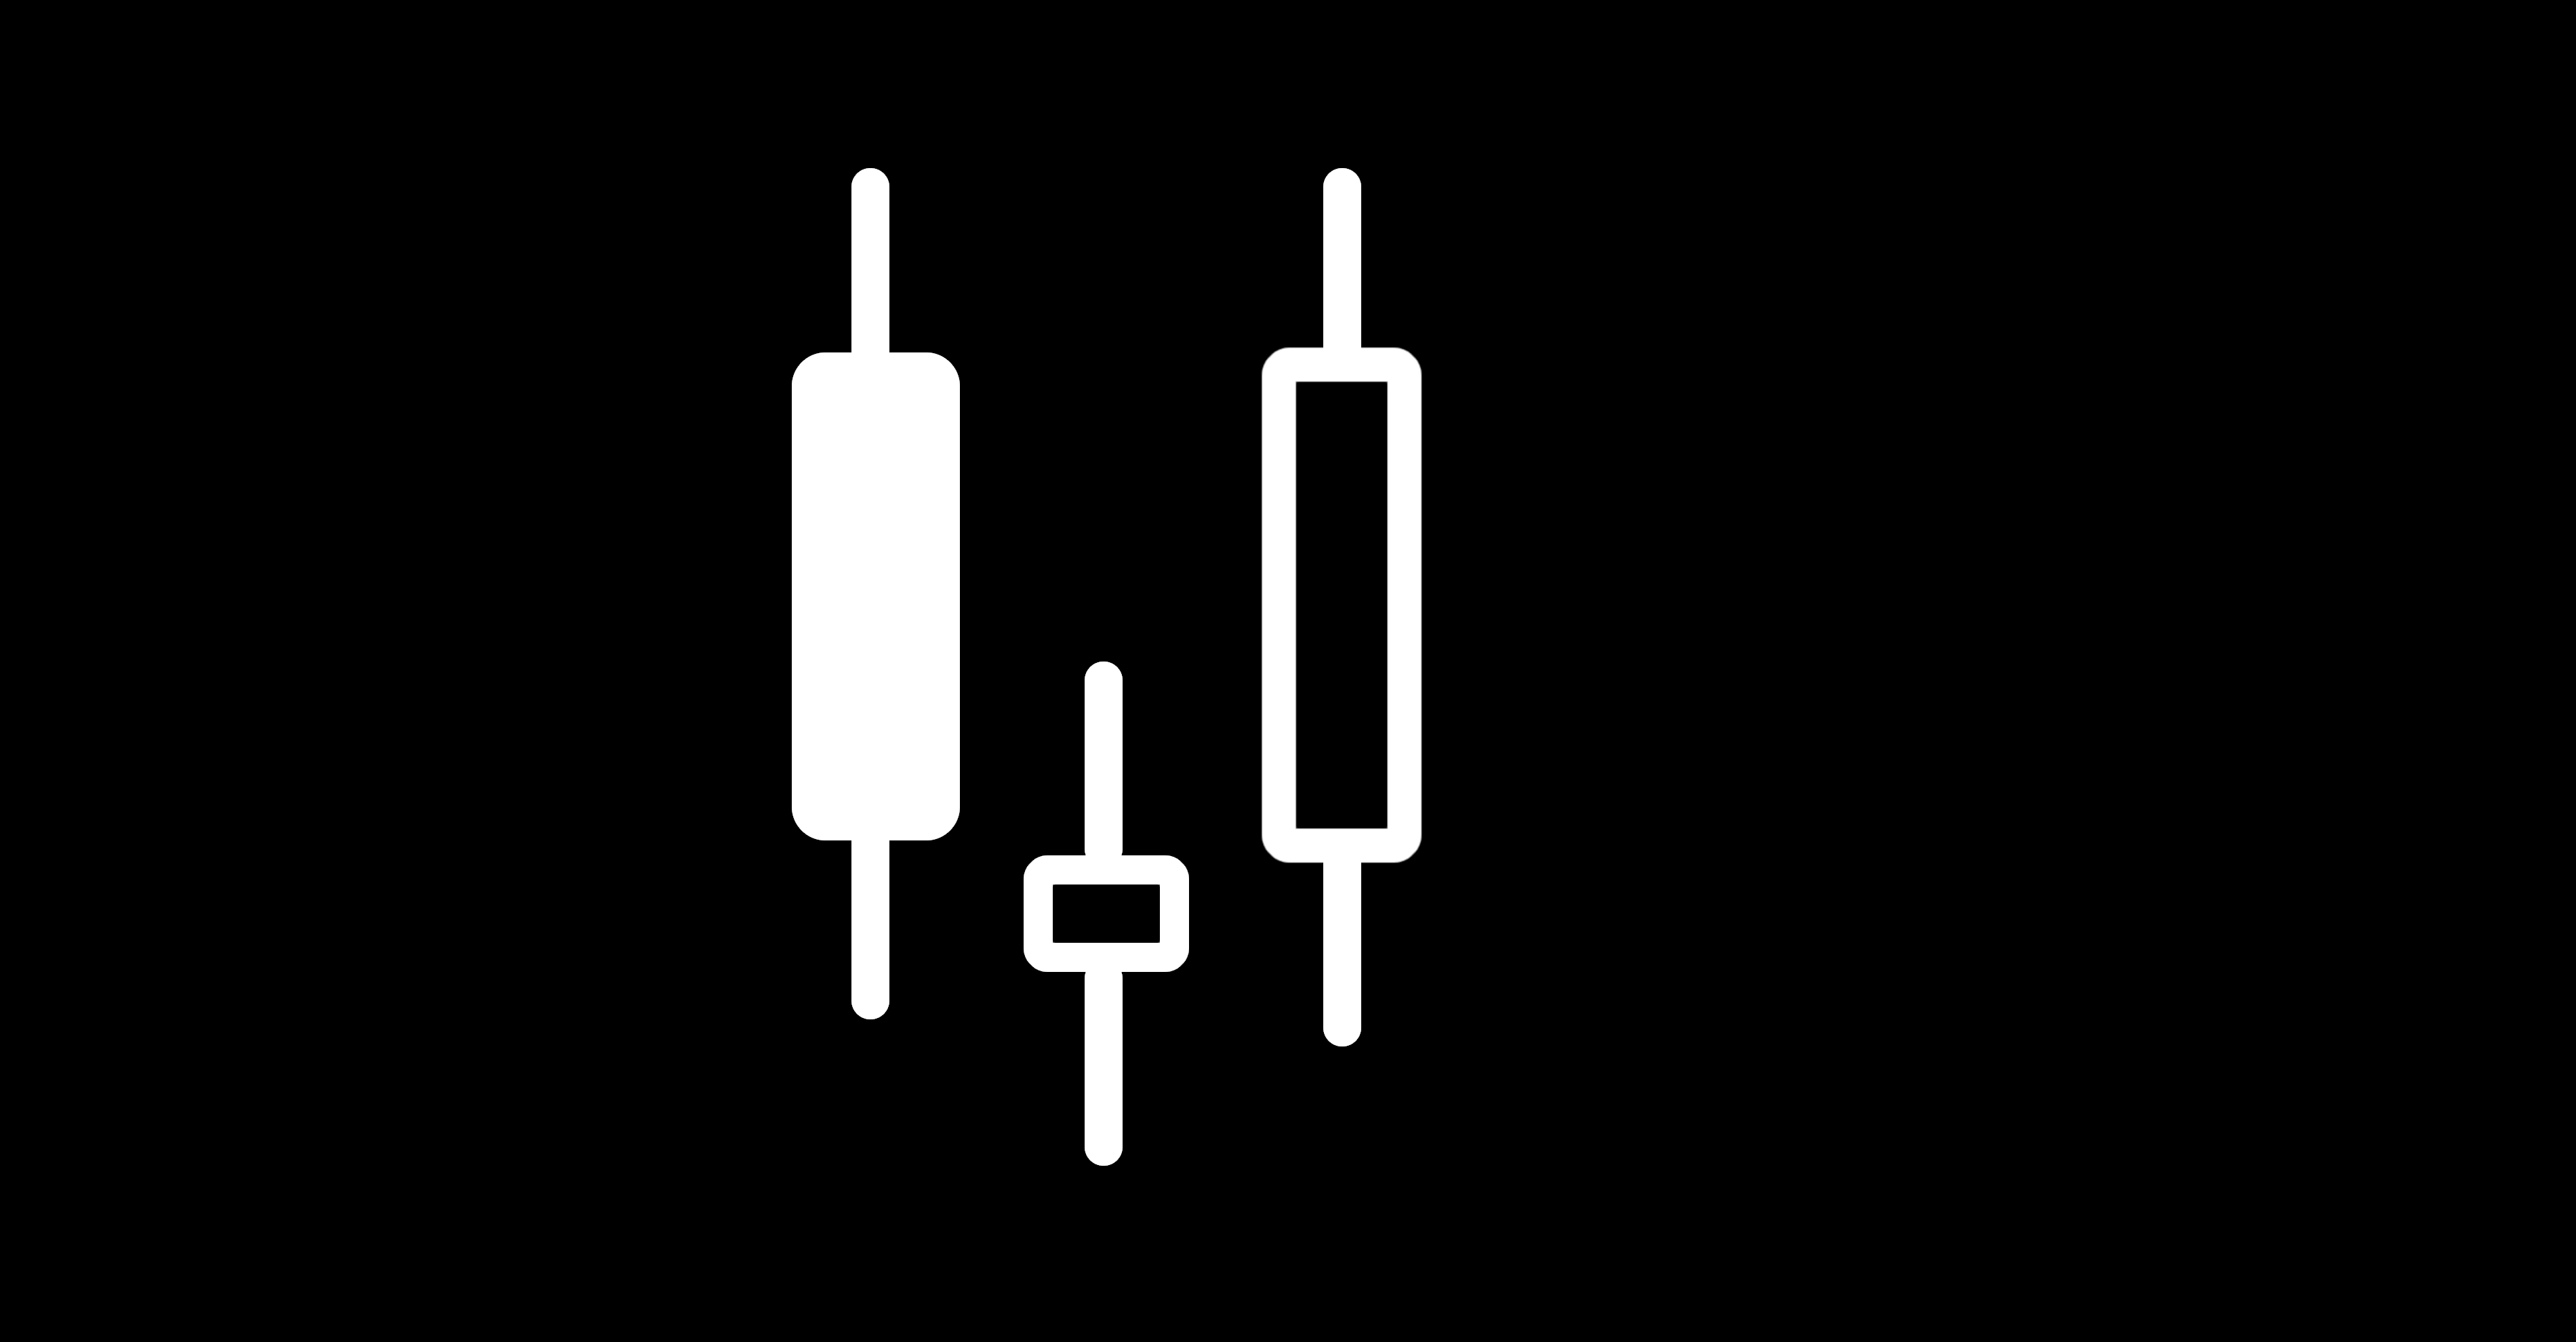
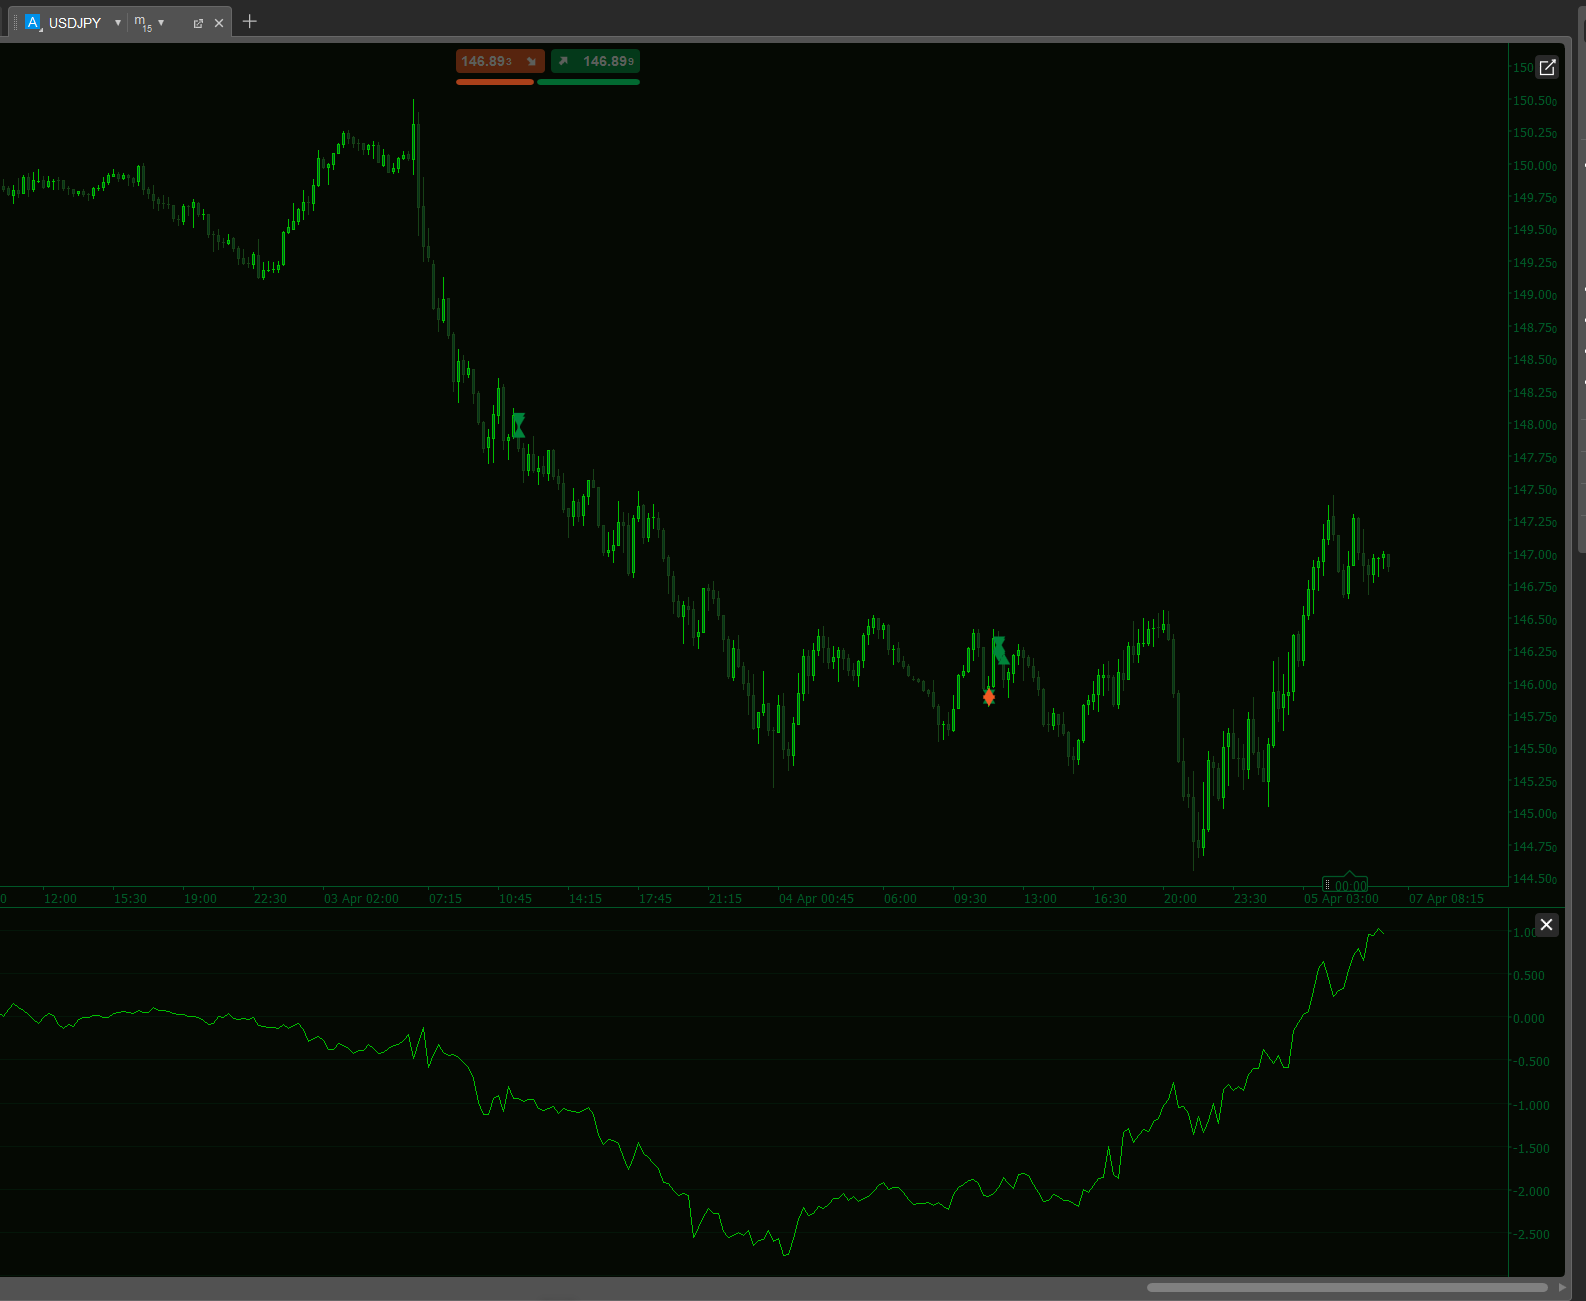
Shows BUY & SELL signals for 3 & 4 BAR PATTERN (Morning star/ Evening star). It is adjustable and it will SHOW ARROWS.

More from this author
DMI CUSTOM SESSIONS
This will allow you to have SESSIONS on the chart. London, New York, Asian session and you can customize the times.
DMI MONDAY ZONES v2.1
Marks Monday's OPEN,HIGH & LOW. These are areas of support and resistance for the week.
Morning Star On Chart
Morning Star pattern on chart (Bullish and Bearish) automatically marked with (BUY & SELL) Very powerful signals.
You may also like
Parabolic RSI Alert  V1
Master RSI reversals with Parabolic SAR precision! Get real-time alerts for high-probability trend changes.
MTF Candle Window - On Chart
The Multi-Timeframe Candle Indicator displays candles from multiple timeframes in one window, enhancing market analysis!
Indicator
Indices
Prop
XAUUSD
+8
Average Cost Price
Average Cost Price helps you keep track of your open positions on the chart. In doing so, it provides lines and explanat
Indicator
Stocks
Forex
Crypto
+1
Market Structure SNR + Auto Bias
Market Structure Indicator – Your Trading Map in a Noisy Market. No more Panicking Which one, Where, Why and How.
DMI MONDAY ZONES v2.1
Marks Monday's OPEN,HIGH & LOW. These are areas of support and resistance for the week.
Indicator
Indices
Forex
Signal
+2
US Dollar Index
US Dollar Index
LT Flexible Volume Profile
Flexible Volume Profile, designed with performance in mind.
SmartFibonacci
SmartFibonacci — automatic Fibonacci retracements & extensions with swing detection, alerts and clean labels for cTrader
Tabajara corrigido[fix]
corrigido todos os bugs e cores invertidas tabajara antigo deleetado
Quantitative Qualitative Estimation
The QQE (Quantitative Qualitative Estimation) Weighted Oscillator improves its original version by weighting the RSI.
Cumulative Delta_noSourceCode
Demo of my main indcator.
Indicator
RSI
Breakout
Supertrend
Leverage Liquidation Map
📊 Liquidation Map: Potential areas where highly leveraged investors might face liquidations.
VegaXLR - cTrader Chart Themes
Free chart themes for the cTrader platform.
PriceLevels
Displays the previous day's, last week's, and last month's highest and lowest price levels on your chart.
IR Candle Open
IR Candle Open plots customizable opening price lines for daily, weekly, and monthly candles
Indicator
NAS100
Indices
Breakout
+7
ORB Range with FVGs
This indicator plots the 15m opening range of the NY session with the first N FVGs presented on the chart after the open
Indicator
Scalping
Grafico Diario
Bússola para Decisões de Trading Precisas e Eficientes!