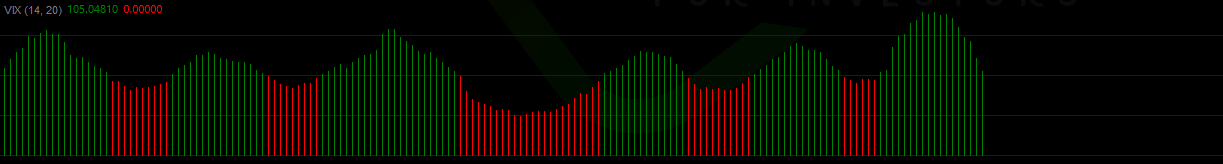
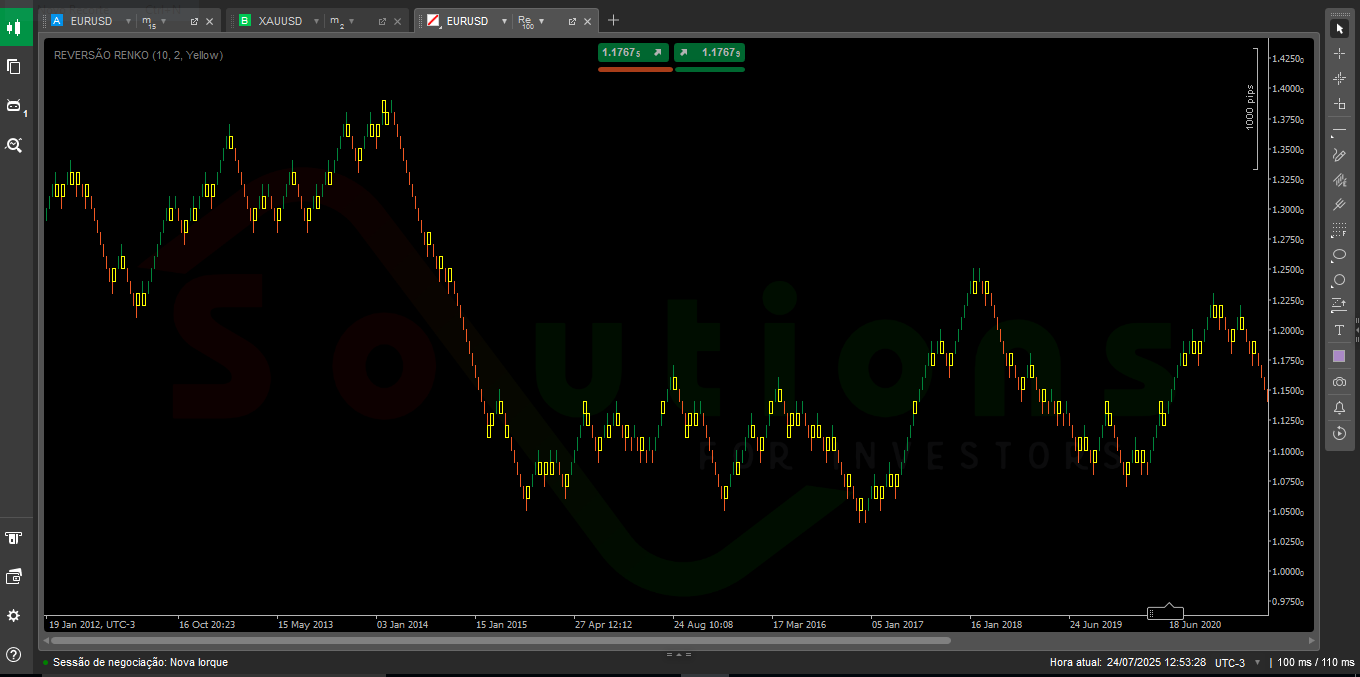
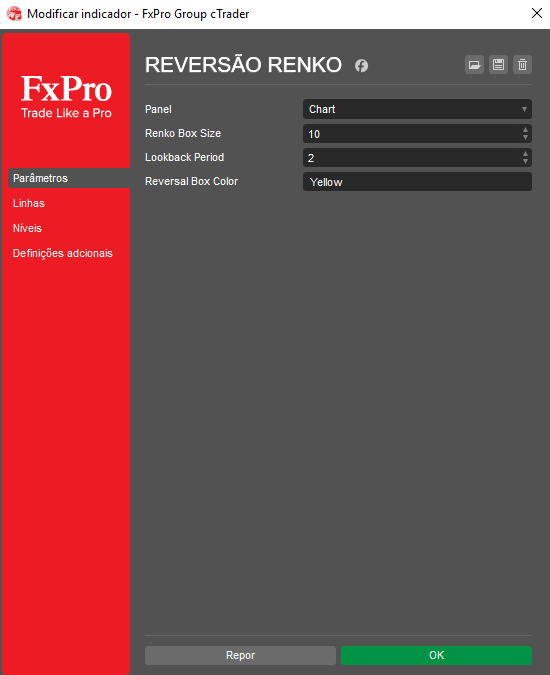
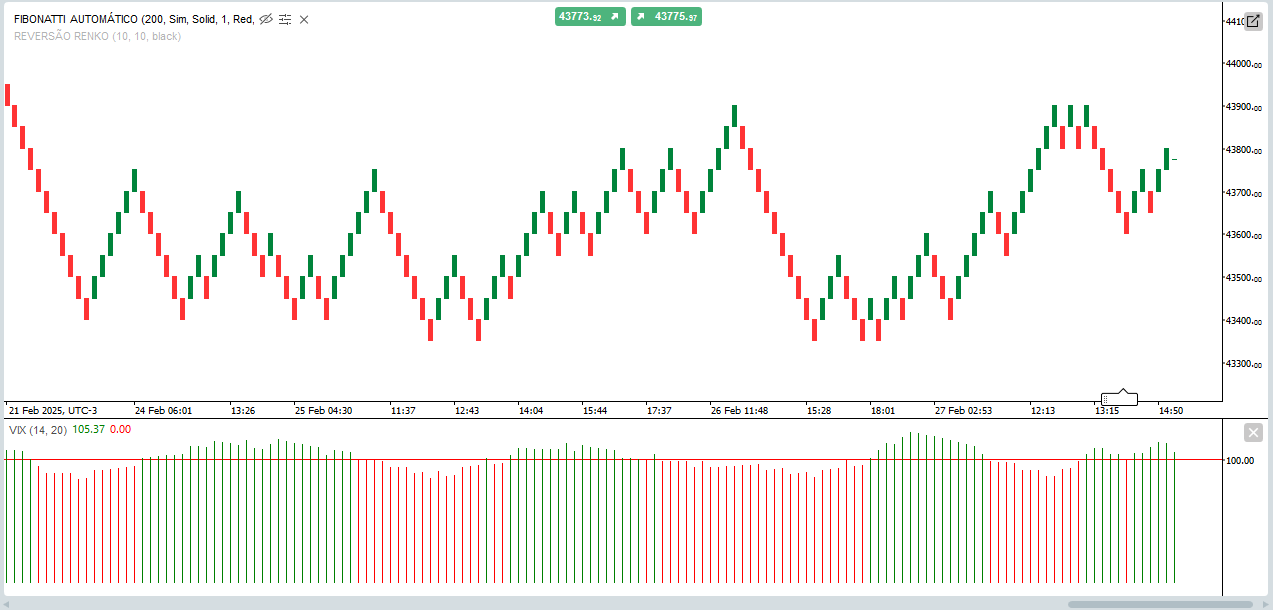
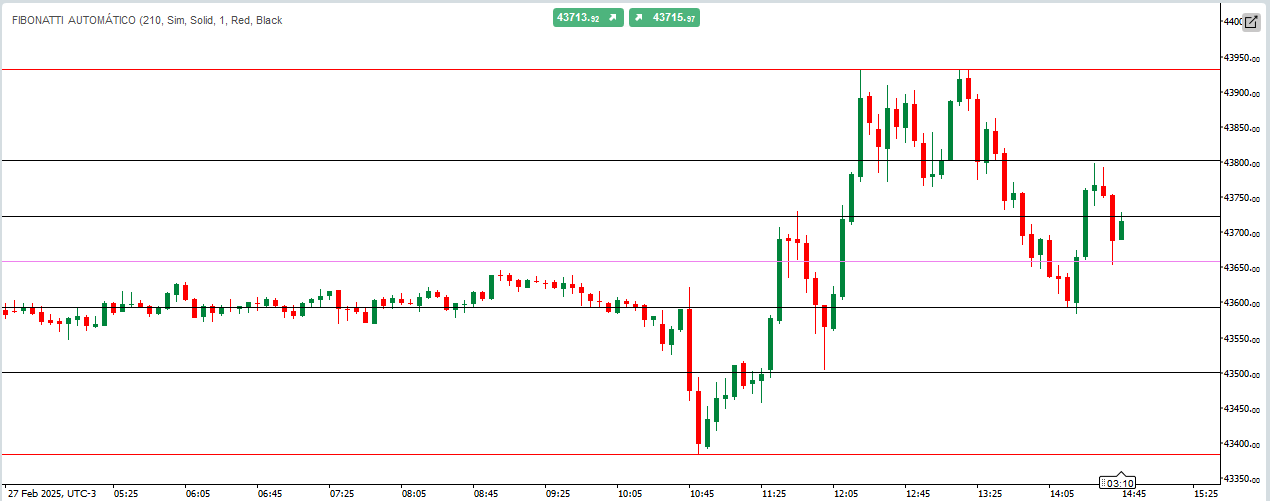
Renko Reversal
"Renko Reversal" logo
01/09/2025
6
Desktop
Since 05/02/2025
Sales
11
"Renko Reversal" uploaded image"Renko Reversal" uploaded image"Renko Reversal" uploaded image

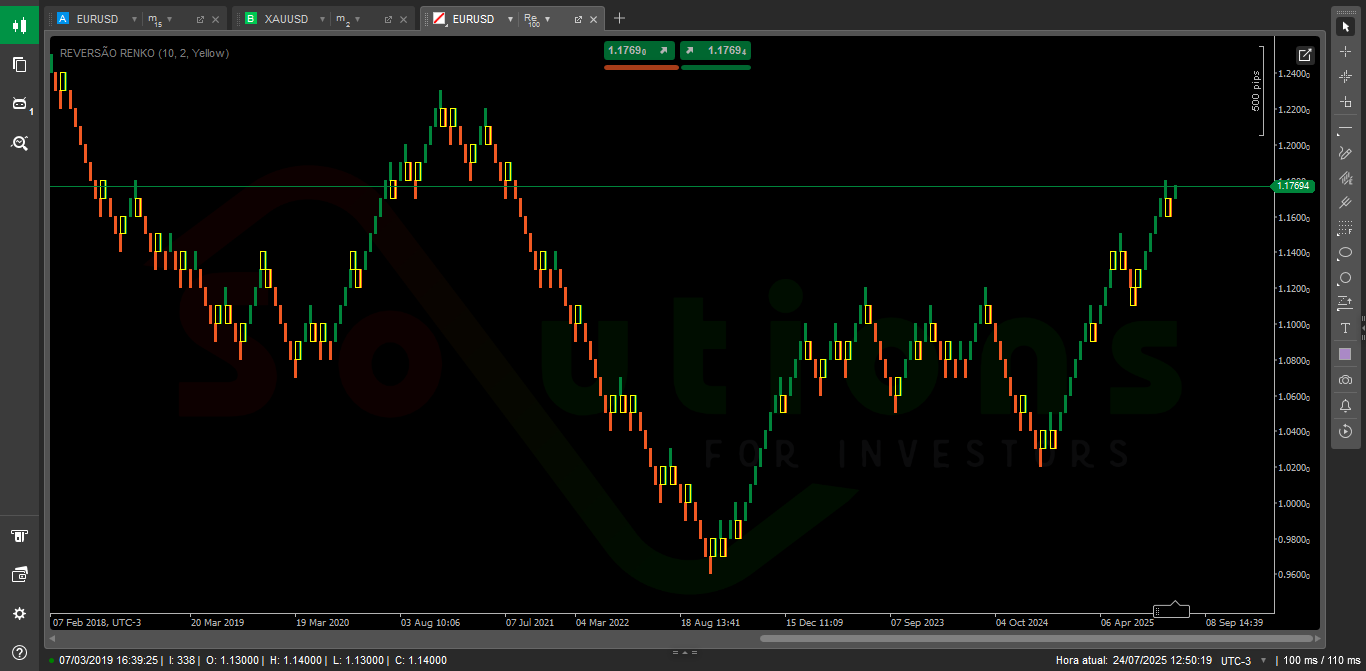
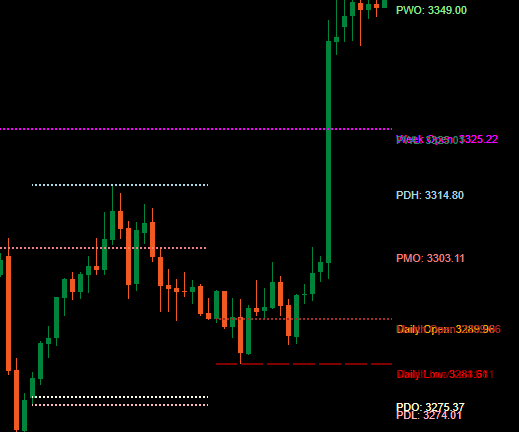
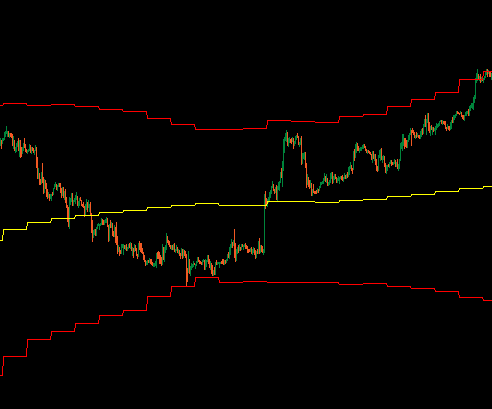
Unlock Powerful Market Turns with the Renko Reversal Indicator for cTrader

The Renko Reversal Indicator is your edge for spotting clean and early trend reversals. Powered by Renko price action and ATR-based precision, this tool highlights high-probability turning points by changing block colors at key rejection zones. Eliminate noise, focus on momentum shifts, and trade with confidence — whether you're scalping or swing trading.

More from this author
VolumeColorBar
Color Volume Bars – Visualize Market Strength Instantly
Indicator
Breakout
VIX - volatility indicator
Ride the Volatility – Smart VIX Tool
Automatic Fibonatti
Automatically plots Fibonacci retracement levels using the highest and lowest points of a customizable time range
Indicator
Breakout
VIX - volatility indicator - Renko
Volatility indicator for Renko.
Automatic Fibonatti - Renko
Automatically plots Fibonacci retracement levels using the highest and lowest points of a customizable time range.
Indicator
Indices
RSI
RSI
RSI Pro Tool – Overbought & Oversold Made Easy
BOT REJECTION - SOLUTIONS FOR INVESTORS
Rejection Bot – Precision Trading at Key Levels
Indicator
Indices
Prop
Commodities
+3
ADX Indicator_noSourceCode
Identify Trend Strength with Absolute Precision on cTrader
You may also like
Indicator
NAS100
Indices
Breakout
+6
All-in-One Session Levels Suite
Institutional Session Levels Pro OHLC,Prev(D,W,M OHLC)
Chaikin Money Flow
Chaikin money flow's primary purpose is to distinguish between periods of accumulation and distribution of a security.
Indicator
Indices
Breakout
Prop
+9
IBS Indicator
IBS Indicator – Measures price position within bars for smarter trades. Works on all markets & timeframes.
MA Sabres
Conquer the markets with MA Sabres! This indicator spots trend flips with MAs and cool Sabre shapes & alerts.
Pivot Points
Pivot Points Indicator
Stochastic RSI Indicator
HTFBB
Plot higher-timeframe Bollinger Bands for clearer structure, pullback zones, and breakout signals—without switching char
[Stellar Strategies] BOS Trend 1.0
[Stellar Strategies] BOS Trend: Premium multi-timeframe BOS indicator for precision trend analysis.📈📉
Indicator
Prop
Commodities
Stocks
+2
Light-Version BrickAlgo TrendPulse
🚀 Simplify Your Trading Decisions With Powerful Technical Analysis.
Indicator
RSI
XAUUSD
Breakout
+5
Channel Price Predictor
🔮Channel Price Predictor: Anticipates future price zones with trend channels based on volatility and projections." 📈
Indicator
Breakout
XAUUSD
Commodities
CursorByte.SupportResistance v3
Draws support and resistance on all pairs. Multi-timeframe support.
[Hamster-Coder] Pivot Points (Demo)
[Hamster-Coder] Pivot Points (Demo)
Indicator
NAS100
NZDUSD
XAUUSD
+10
RT Moving Average PRO v1.1
Customize your Moving Average! Choose any timeframe and price source for precision and flexibility in your analysis.
Indicator
Indices
Stocks
Forex
+1
Bullet Chart
✅ Unique Design. ✅ Works on All Time frames
Indicator
Signal
USDJPY
On Balance Volume USD - Combined
See USD demand in one line—Composite OBV fuses six major FX pairs into a clear momentum gauge.
Indicator
NAS100
NZDUSD
XAUUSD
+12
Coral Filter Lite
🐠 Free trend baseline - without the noise. Free limited version of Coral Filter X Pro 🐠
DynamicVolumeSupplyDemand
Supply and Demand Zones
Indicator
Breakout
3 Bar Triangle by Linda Raschke
3 bar triangle = high below 2 day high, low above 2 day low