
DynamicVolumeSupplyDemand
Indicator
1.29K downloads
Version 1.0, Apr 2025
Windows, Mac
4.2
Reviews: 5
Description
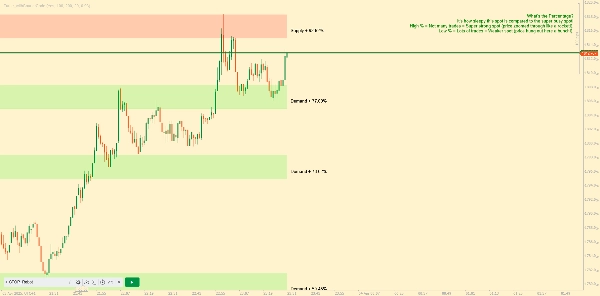
Introducing the Dynamic Supply and Demand Zones by AlgoAlpha recreated by me for Ctrader Platform. This indicator is designed to automatically identify and visualize dynamic supply and demand zones on your chart, helping traders pinpoint potential reversal areas and assess market sentiment with enhanced clarity. It adapts to market conditions using a dynamic look-back mechanism, making it more responsive to recent price movements. 📈💡
Key Features
- 📊 Dynamic Look-Back: Automatically adjusts the look-back period based on the most recent pivot point, ensuring the most relevant data is analyzed.
- 🎯 Pivot Point Detection: Utilizes a user-defined period to detect significant pivot highs and lows, marking potential reversal points with precision.
- 🛠 Customizable Parameters: Offers extensive customization options including look-back period, pivot detection sensitivity, resolution, and zone tolerance.
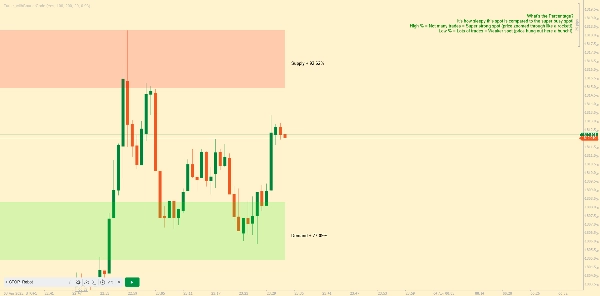
- 🗺 Visual Display: Shows supply and demand zones as boxes on the chart, background highlighting to differentiate between bullish and bearish zones.
- 🖍 Color-Coded Zones: Zones are color-coded for easy identification: green for bullish, red for bearish, and gray for neutral levels.
Summary
AI summary
DynamicVolumeSupplyDemand is an indicator for the cTrader platform that automatically identifies and visualizes dynamic supply and demand zones on trading charts. It helps traders locate potential reversal areas and evaluate market sentiment by adapting to recent price movements through a dynamic look-back mechanism. Key features include:
- Dynamic Look-Back: Automatically adjusts the look-back period based on the latest pivot points to analyze the most relevant data.
- Pivot Point Detection: Uses a user-defined period to detect significant pivot highs and lows, marking potential reversal points.
- Customizable Parameters: Allows adjustment of look-back period, pivot detection sensitivity, resolution, and zone tolerance.
- Visual Display: Presents supply and demand zones as boxes on the chart with background highlighting to distinguish bullish and bearish zones.
- Color-Coded Zones: Zones are color-coded for clarity—green for bullish, red for bearish, and gray for neutral levels.
This indicator supports enhanced clarity in market analysis by dynamically adapting to changing market conditions and providing clear visual cues for supply and demand levels.
Indicator profile
Customer reviews
4.2
Reviews: 5
5 | 40 % | |
4 | 40 % | |
3 | 20 % | |
2 | 0 % | |
1 | 0 % |
Customer reviews
October 12, 2025
Could you please make a new indicator so too remove the explanation and how the indicator works written on the chart? Very nice indicator otherwise!
August 12, 2025
Pros: Identifies dynamic supply and demand zones based on volume. Flexible settings, strong visual clarity. Cons: No alerts or tooltips. Lacks history of previous zones and user template saving.
May 15, 2025
This indicator finds the supply and demand areas very well but it has a problem. But the explanation and how the indicator works written on the chart is very annoying. I hope the designer of this software will solve this problem. Thank you
Discussion
FAQ
Products available through cTrader Store, including trading bots, indicators and plugins, are provided by third-party developers and made available for informational and technical access purposes only. cTrader Store is not a broker and does not provide investment advice, personal recommendations or any guarantee of future performance.


Price
Since 09/01/2025
11.78K
Free installs