VIX - volatility indicator - Renko
Indicator
Version 1.0, Feb 2025
Windows, Mac
Description
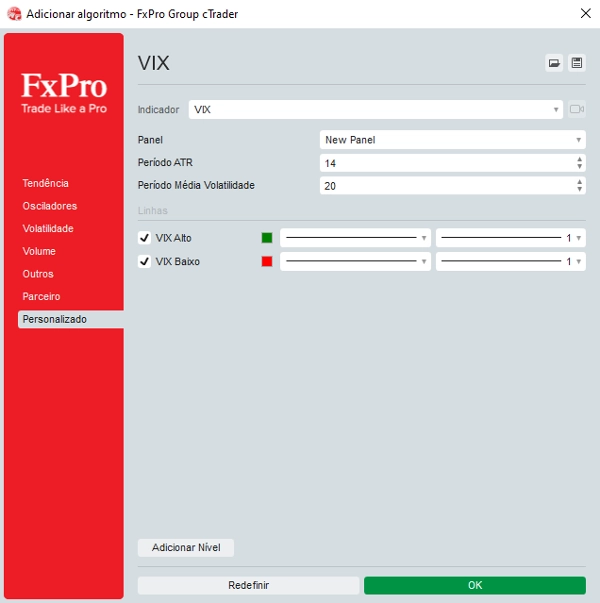
Adjust the parameters: Enter the desired values for the LowLevel and HighLevel levels, and adjust the VIX Scale Factor so that the VIX line is the desired height.
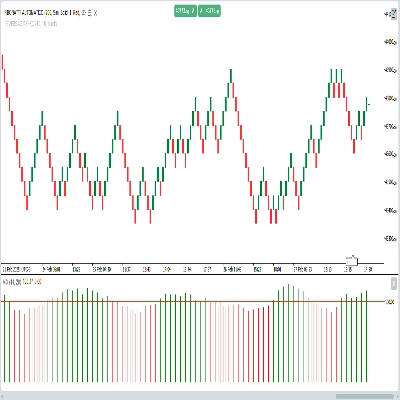
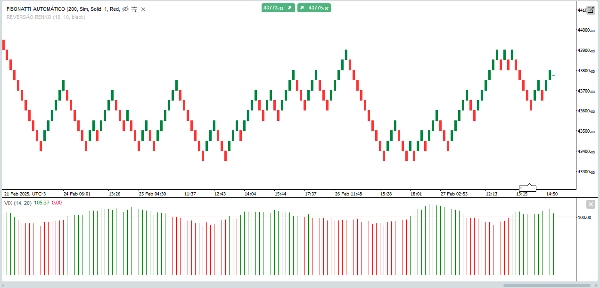
Look at the graph:
When the VIX surpasses the HighLevel and the volume is high (green candles), you can consider that there is a breakout.
When the VIX is below the LowLevel, it may indicate a period of low volatility.
Summary
Indicator profile
Customer reviews
0.0
Reviews: 0
Customer reviews
No reviews for this product yet. Already tried it? Be the first to tell others!
Discussion
FAQ
Breakout
Products available through cTrader Store, including trading bots, indicators and plugins, are provided by third-party developers and made available for informational and technical access purposes only. cTrader Store is not a broker and does not provide investment advice, personal recommendations or any guarantee of future performance.


!["High-Low Divergence [Iridio Capital]" logo](https://cdn.ctrader.com/image/webp/443c4661-7abb-40f1-842f-4b6ec560649b_40914)


Price
Since 05/02/2025
30
Sales