HMA MTF 2.0
.png)
03/09/2025
1
Desktop
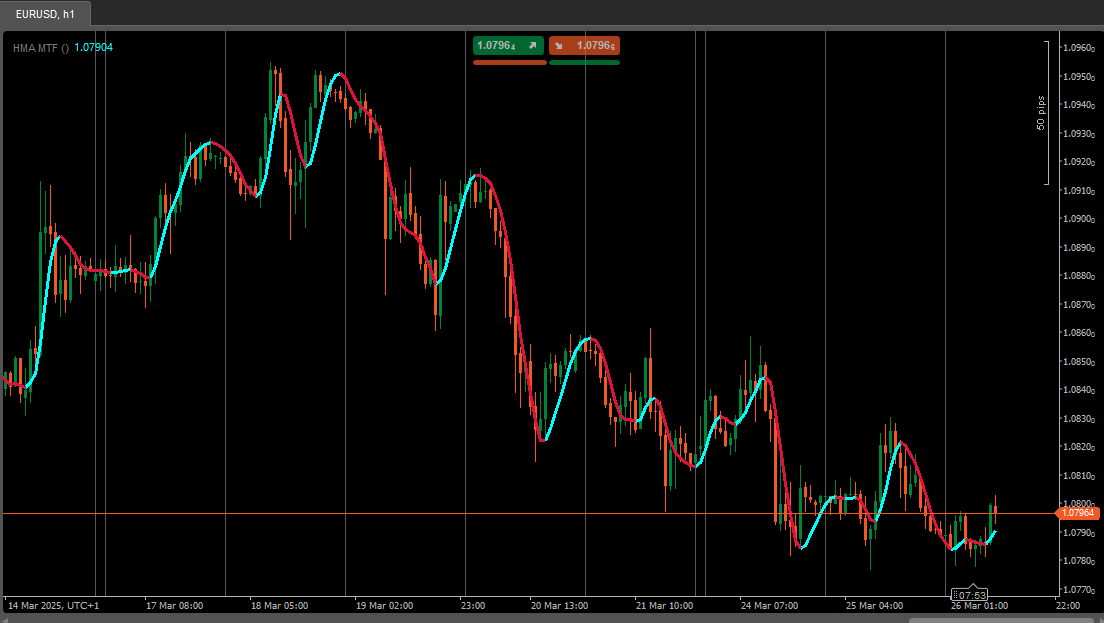
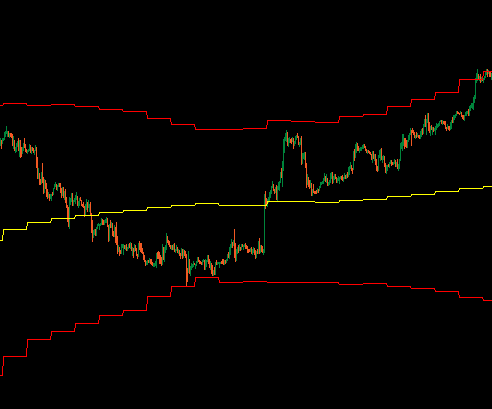
HMA MTF (Multi-Timeframe ) – Indicator Description
The HMAMTF indicator plots a moving average from a higher or lower timeframe onto your current chart and displays it in two color-coded lines, indicating bullish or bearish momentum. It uses cTrader’s built-in Moving Average functionality and calculates whether the trend is up or down by comparing the current MA value to the previous one.
Parameters
- Time Frame (
TimeFrame, Default ="Hour4")
Defines which timeframe’s data (e.g., 4-hour, daily, weekly) will be used to calculate the moving average. - Price (
PriceType, Default =Close)
Specifies which price (Close, Open, High, or Low) is used for the MA calculation. - Period (
int, Default =14, MinValue =1)
The number of bars considered in the moving average calculation. - MA Type (
MovingAverageType, Default =Weighted)
Chooses the moving average method (e.g., Simple, Exponential, Smoothed, Weighted) applied to the selected price series.
.png)

You may also like
!["[Hamster-Coder] Price" logo](https://market-prod-23f4d22-e289.s3.amazonaws.com/b9c21584-bde2-4113-83c1-d6e5d82a9ca1_Icon300.jpg)